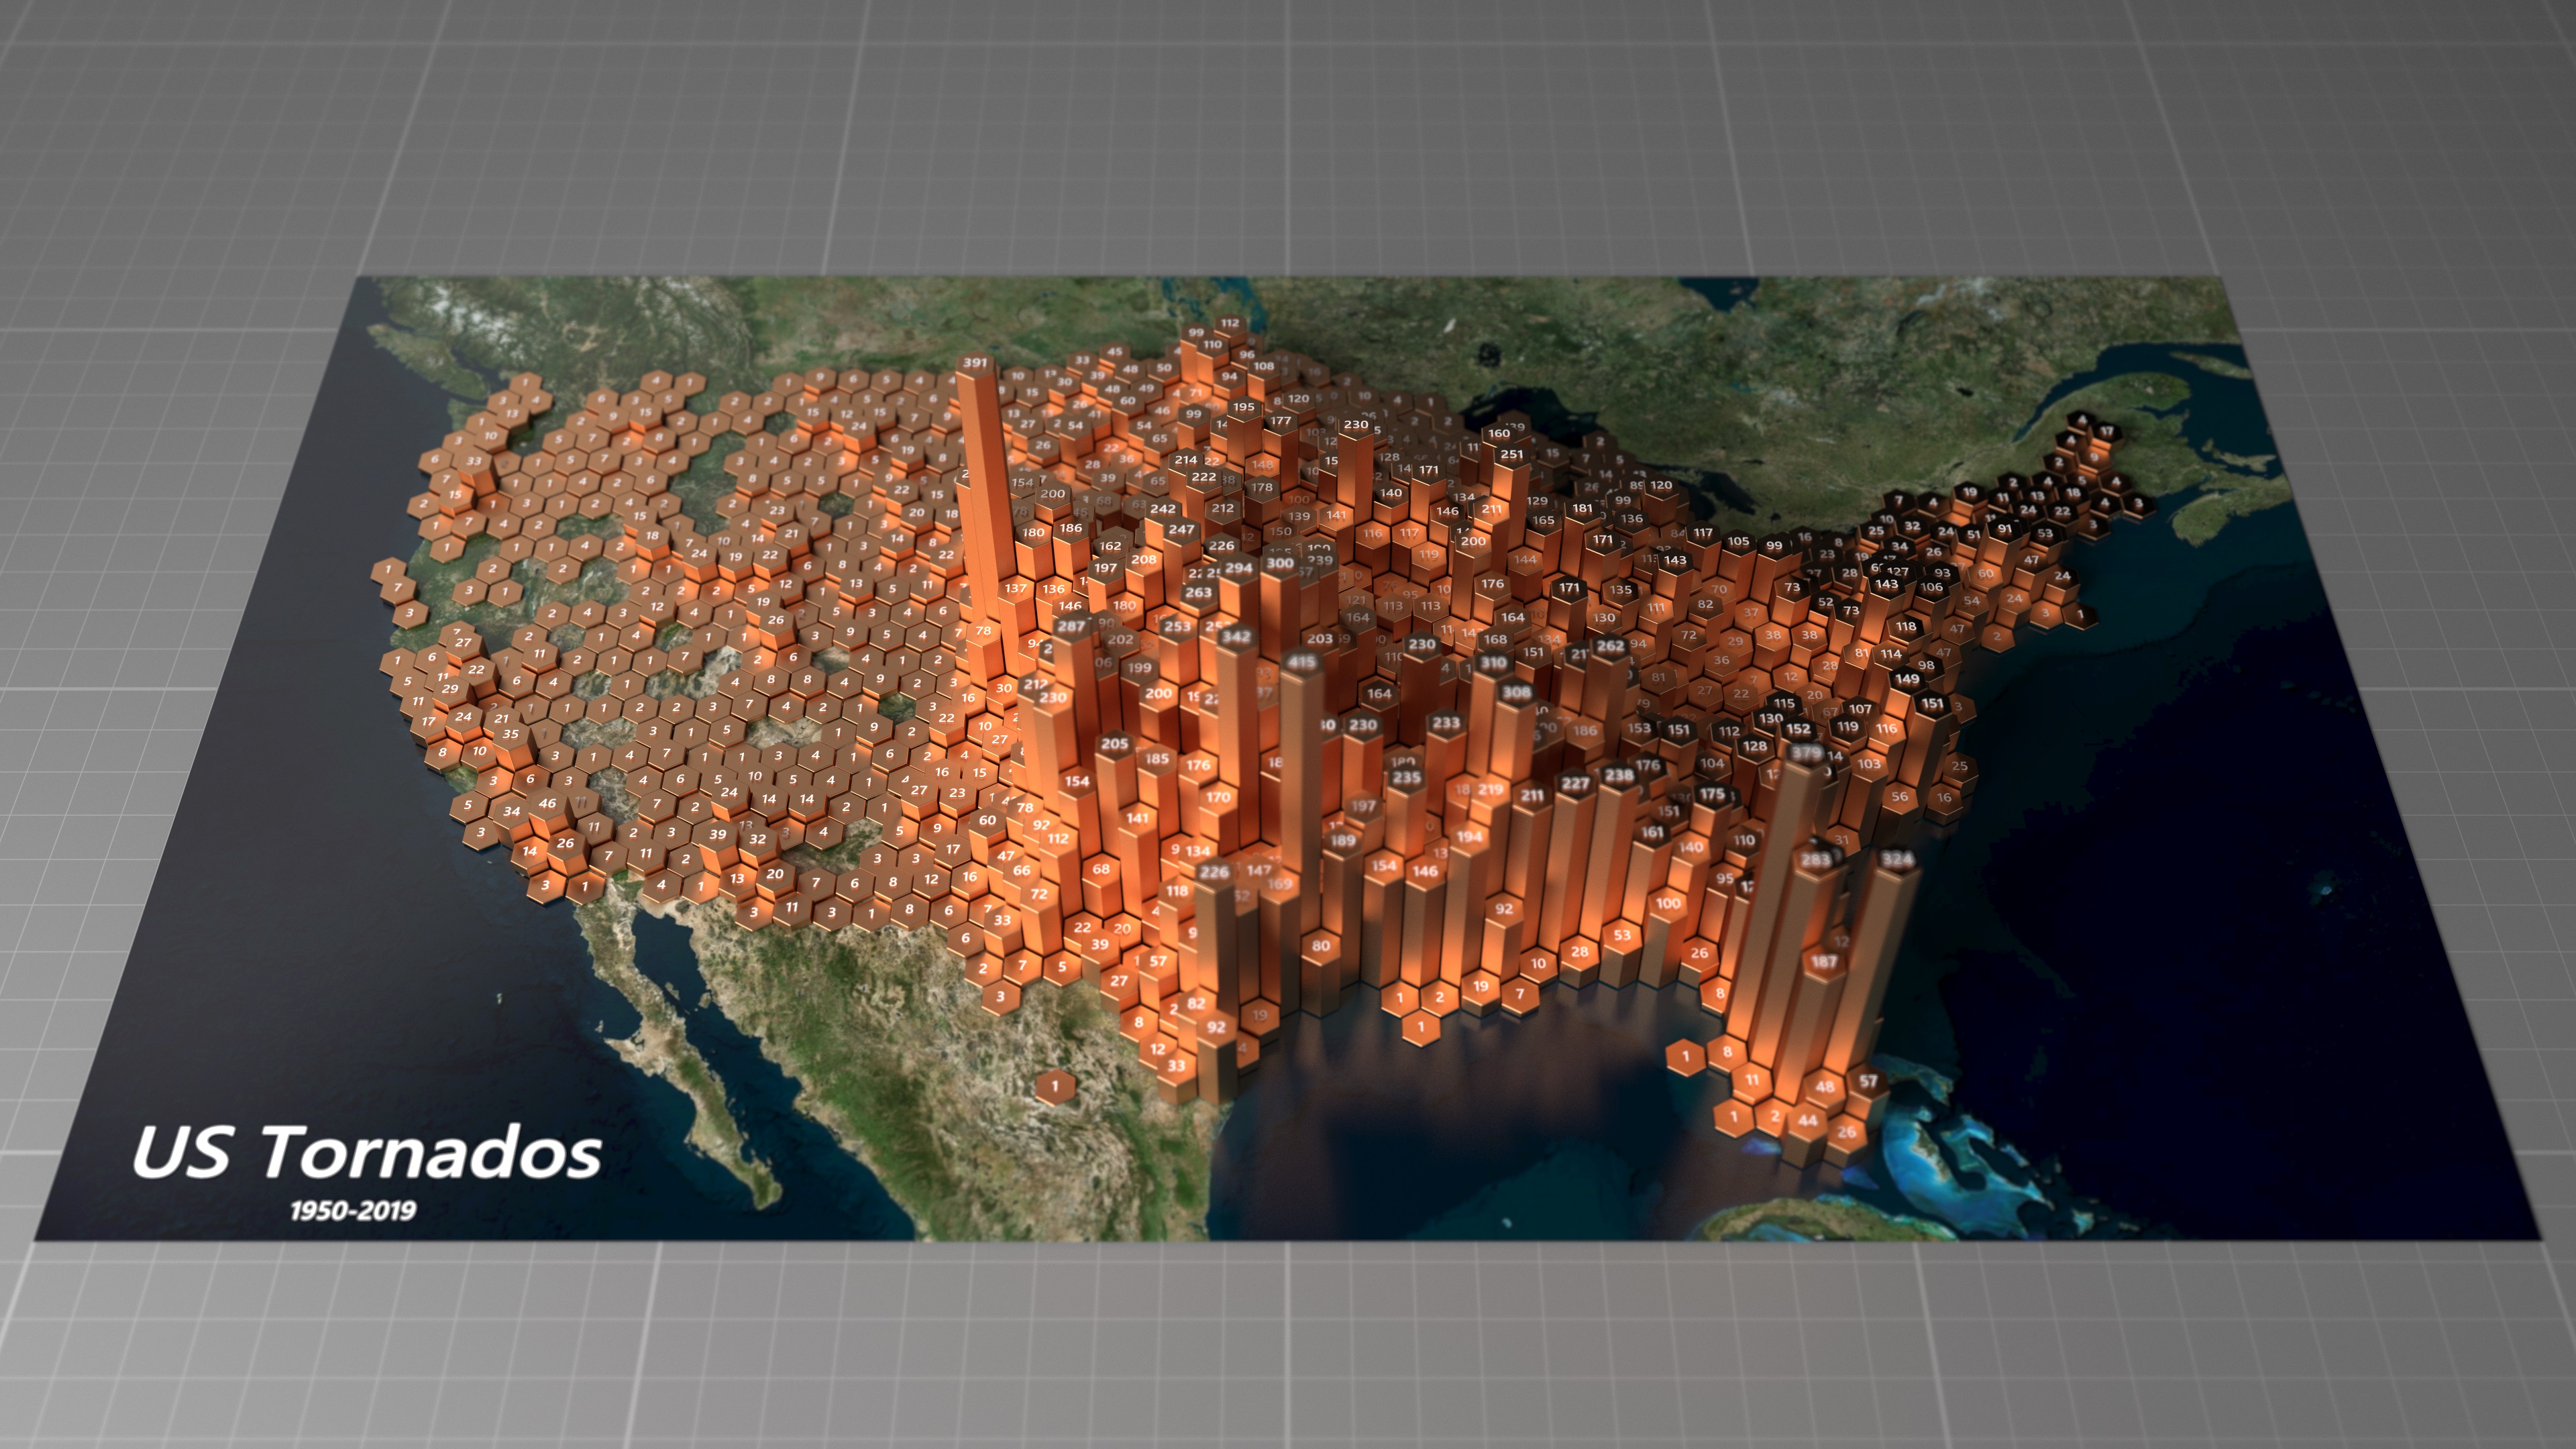
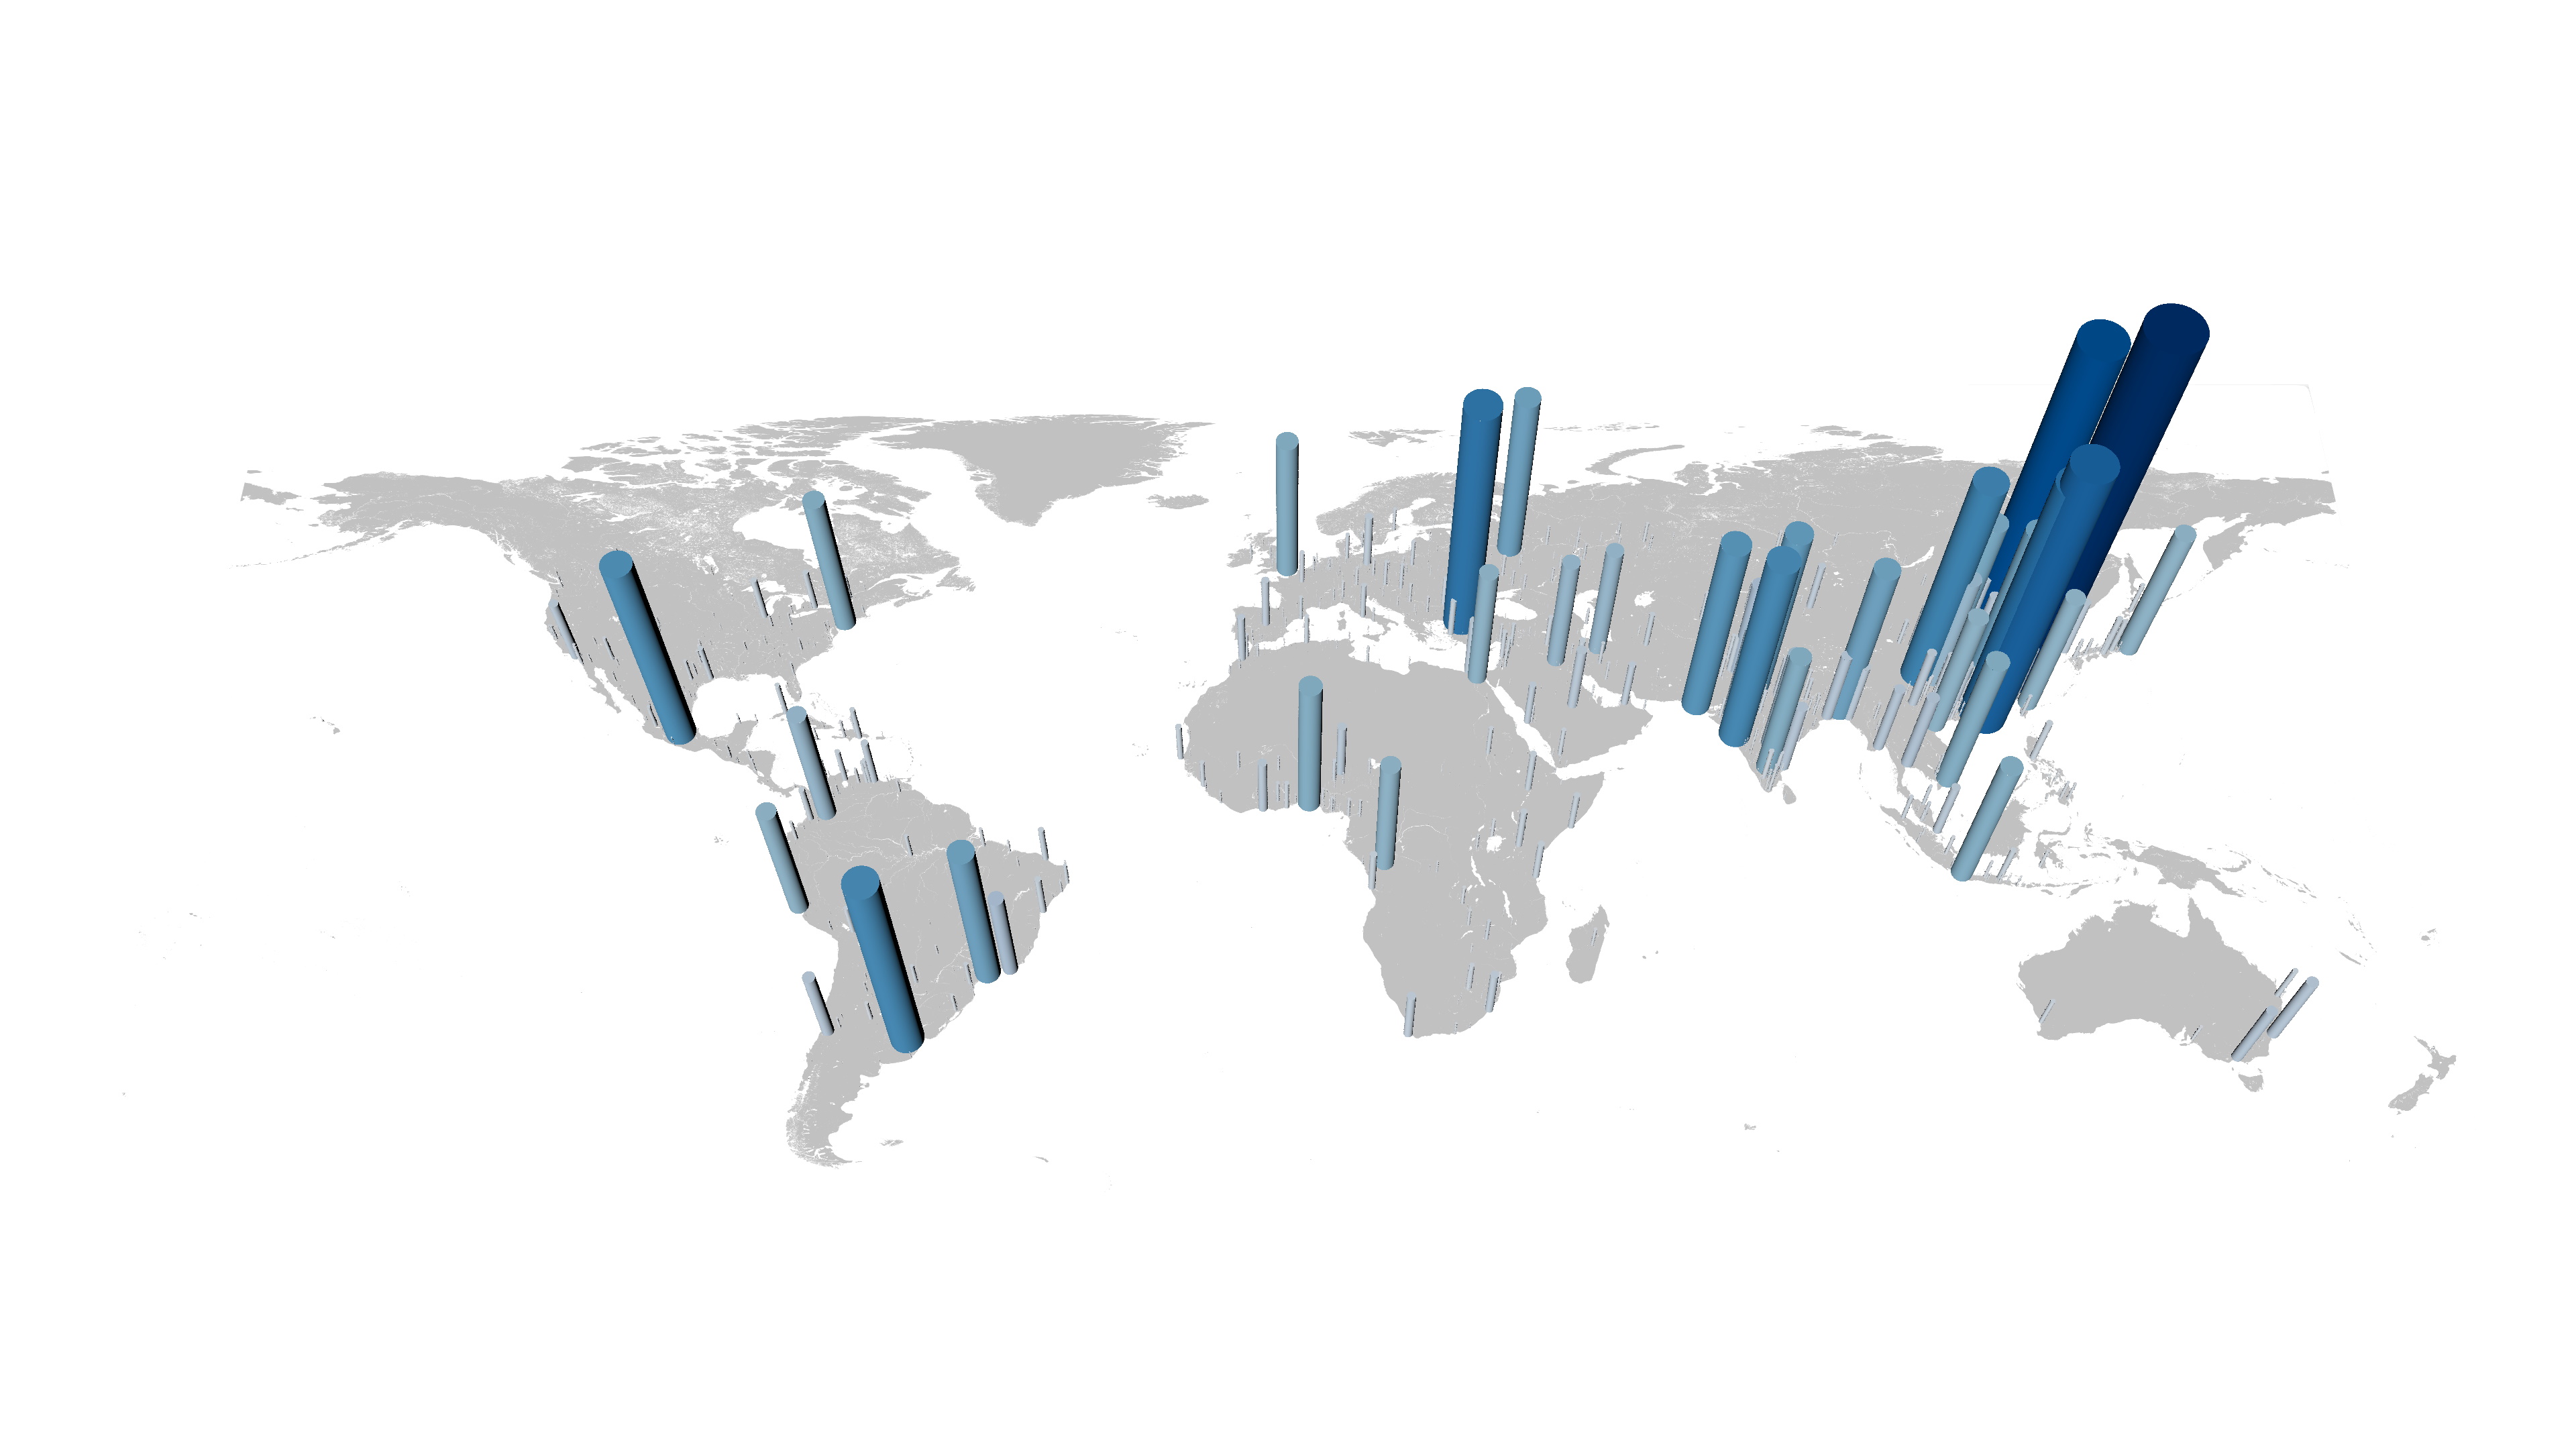
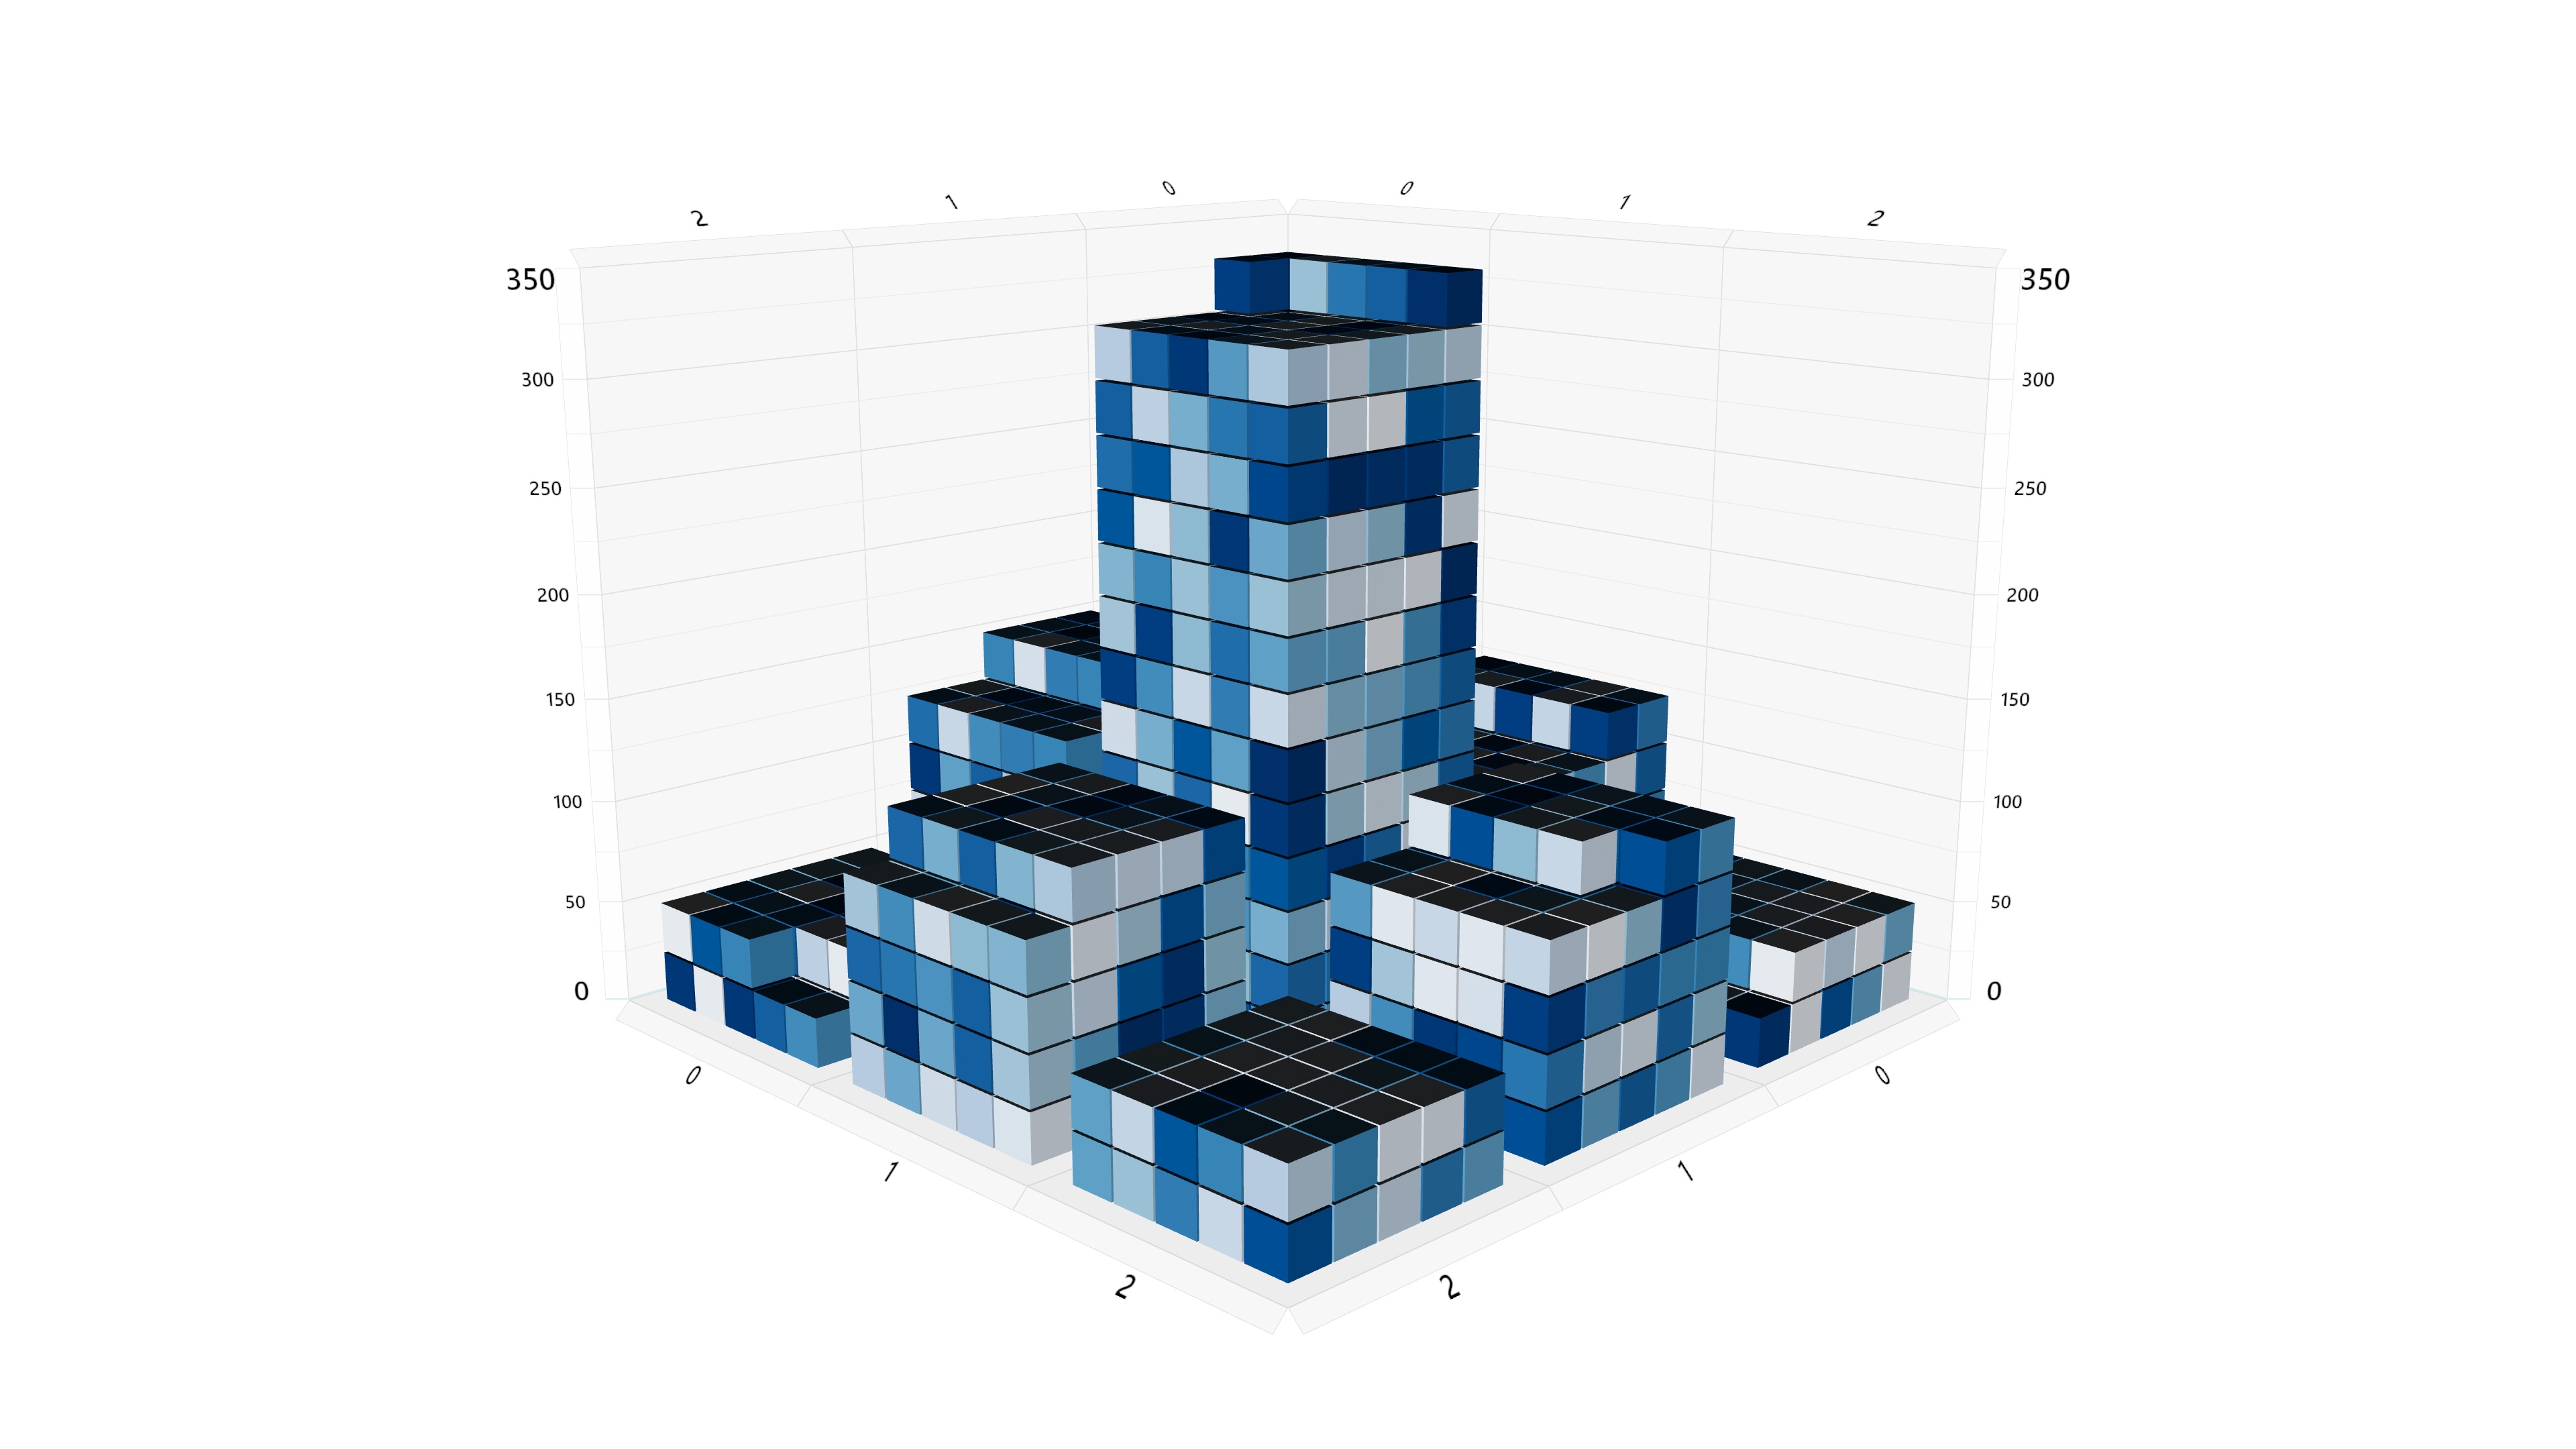
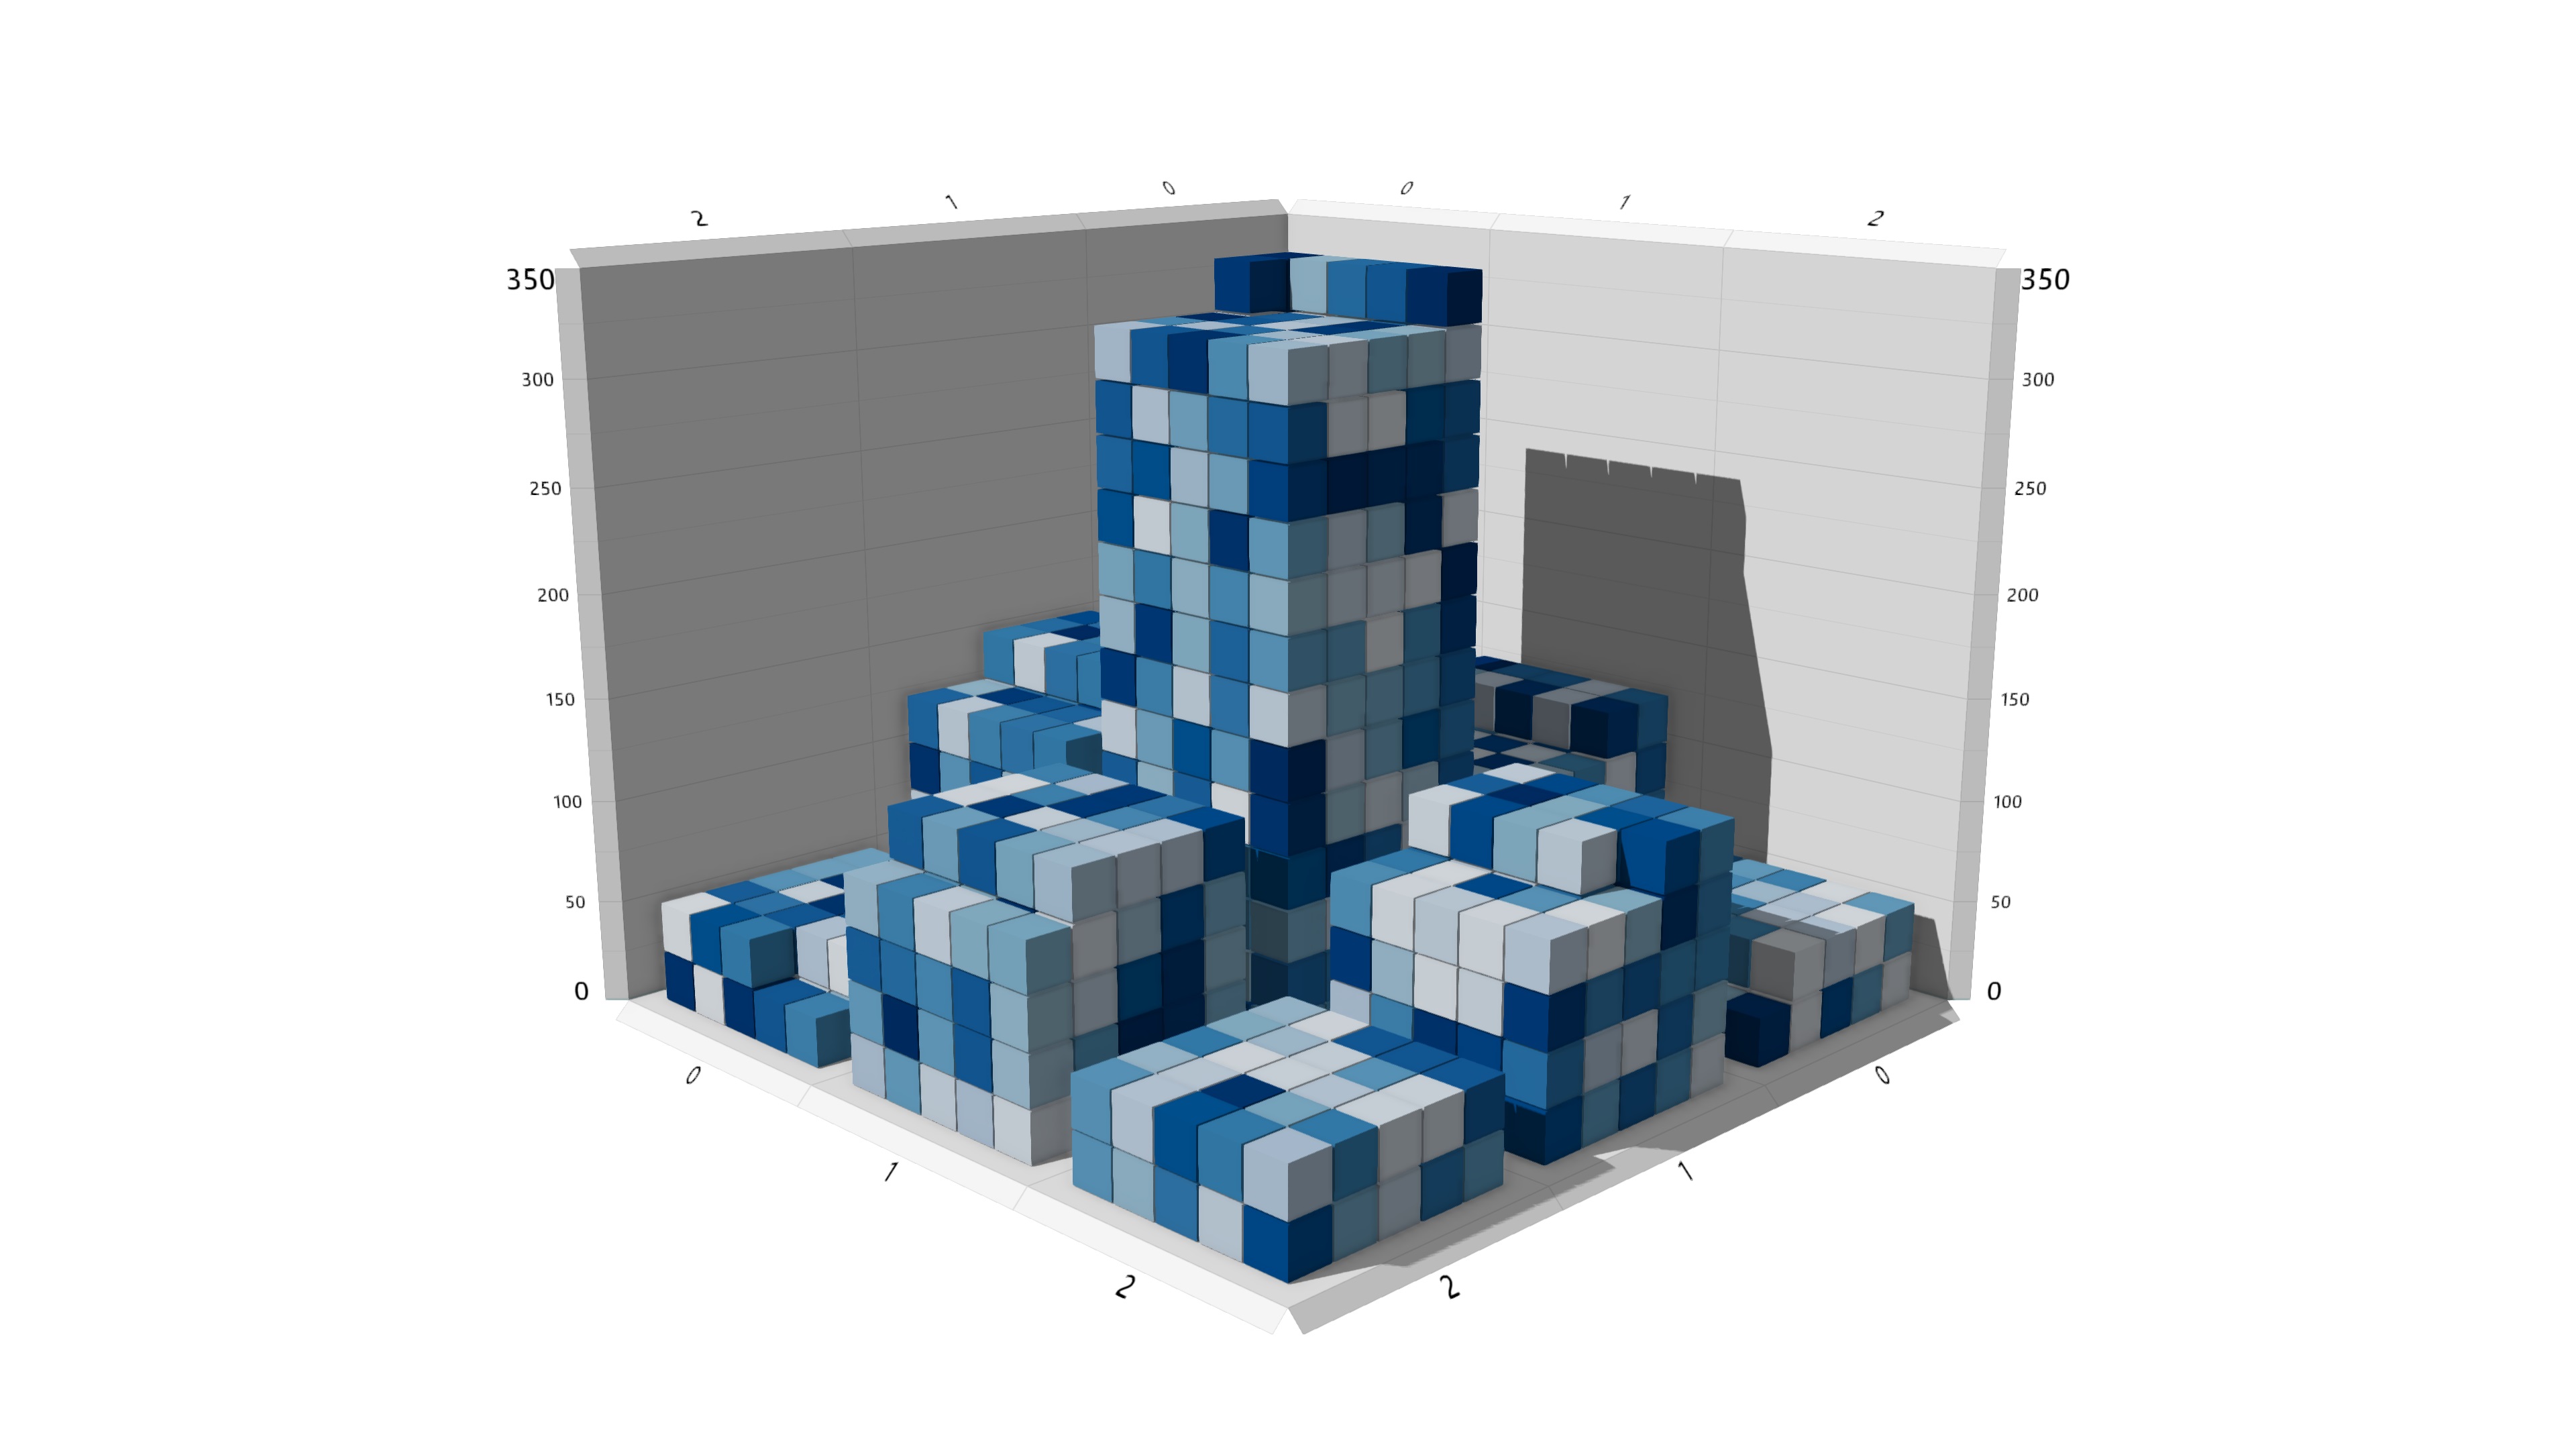
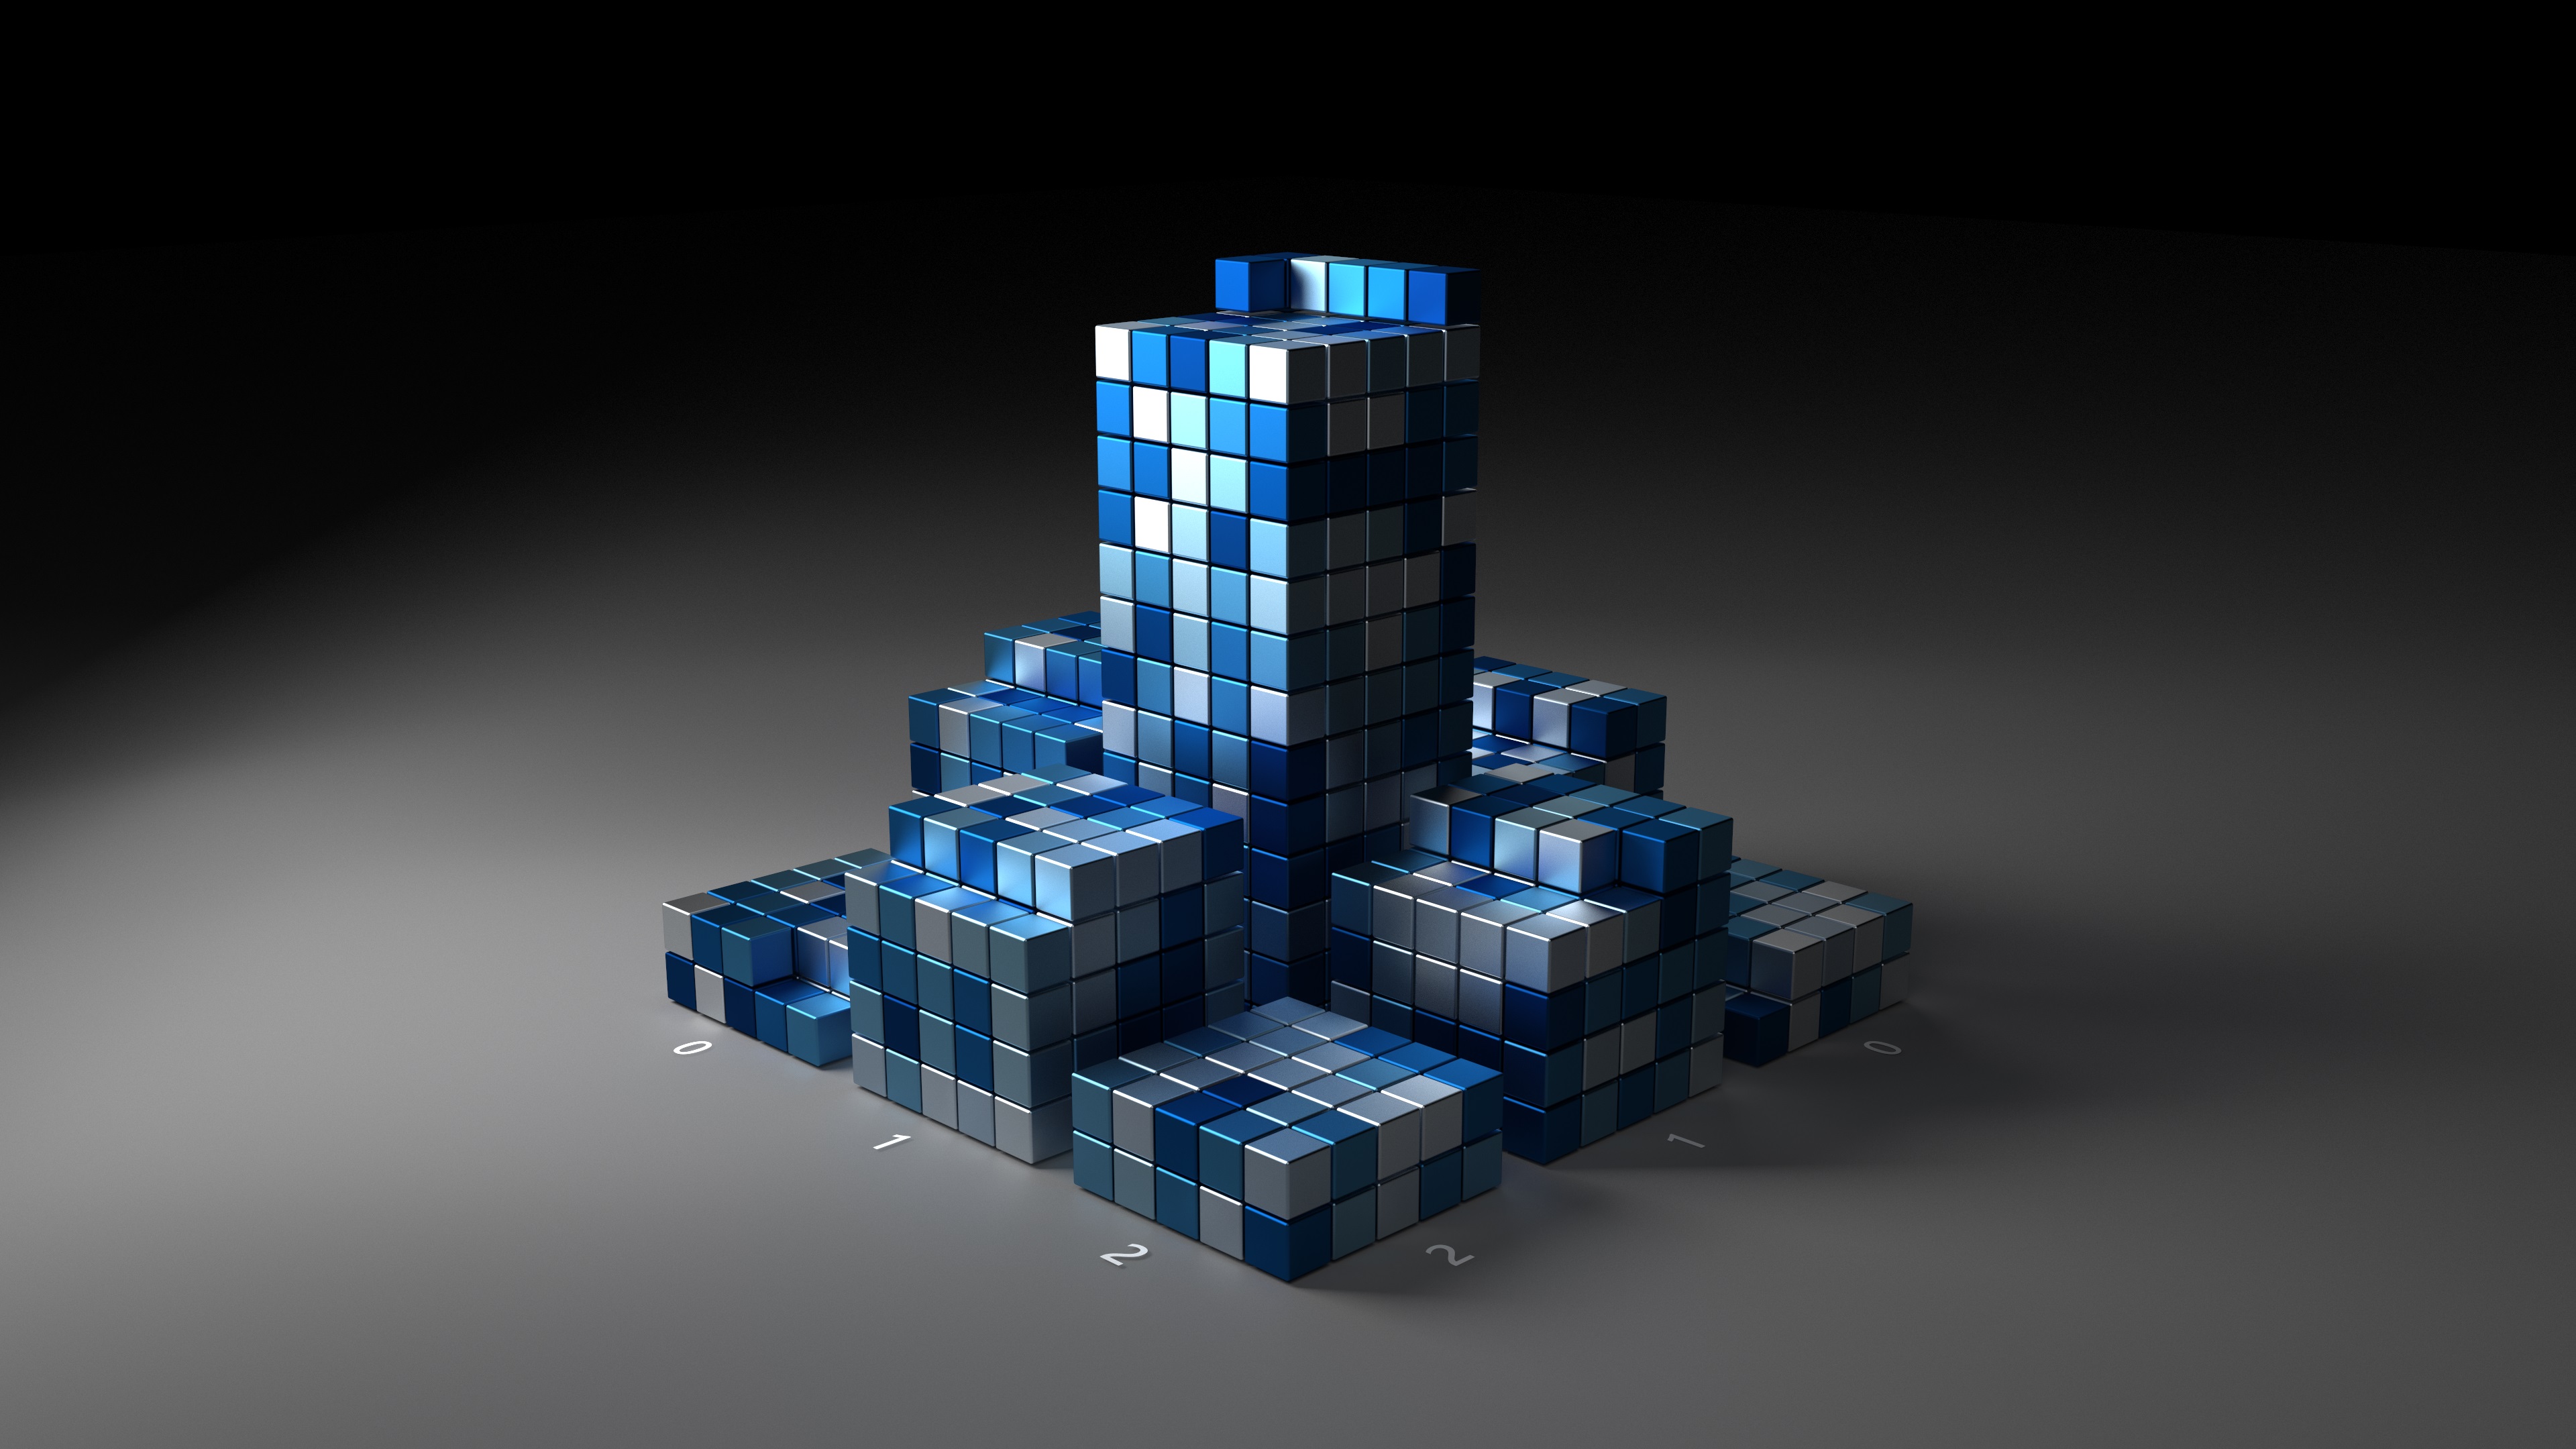
See the gallery for a selection of visualizations created with the MorphCharts raytrace renderer.
MorphCharts is a low-level JavaScript library for interactive and ray traced data visualization in both 2D and 3D.
See the gallery for a selection of visualizations created with the MorphCharts raytrace renderer.
Multiple renderers are provided:
The basic and advanced renderers are designed for interactive data visualization, whereas the raytrace renderer is designed for creating high-quality images and videos.
The latest Chrome 113 now supports WebGPU. In order to use this renderer with Edge, download Edge Canary and enable WebGPU in the experimental features via edge://flags. See https://caniuse.com/webgpu for support status.
Chart layouts are provided for:
Layouts can be combined to create new chart types, for example a node-link graph can be created by combining a scatter plot (for the nodes) and a line chart (for the edges).
Helper functions are provided to support faceting layouts.
Visualizations can specify a pair of layouts such that they can be smoothly animated. This helps a user maintain context while switching layouts, and facilitates building animated data stories.
Data points can transition simultaneously, or in a custom order to create "staggered" transitions.
A default interaction manager is provided for zooming, panning, and rotating the view. Mouse, touch, stylus, keyboard and Surface Dial are supported.
Selections can be made from the axes or with lasso gestures.
Alt-azimuth and arc-ball cameras are provided.
Helper functions are provided for working with 2D and 3D axes. Multiple axes can be used to support faceted views.
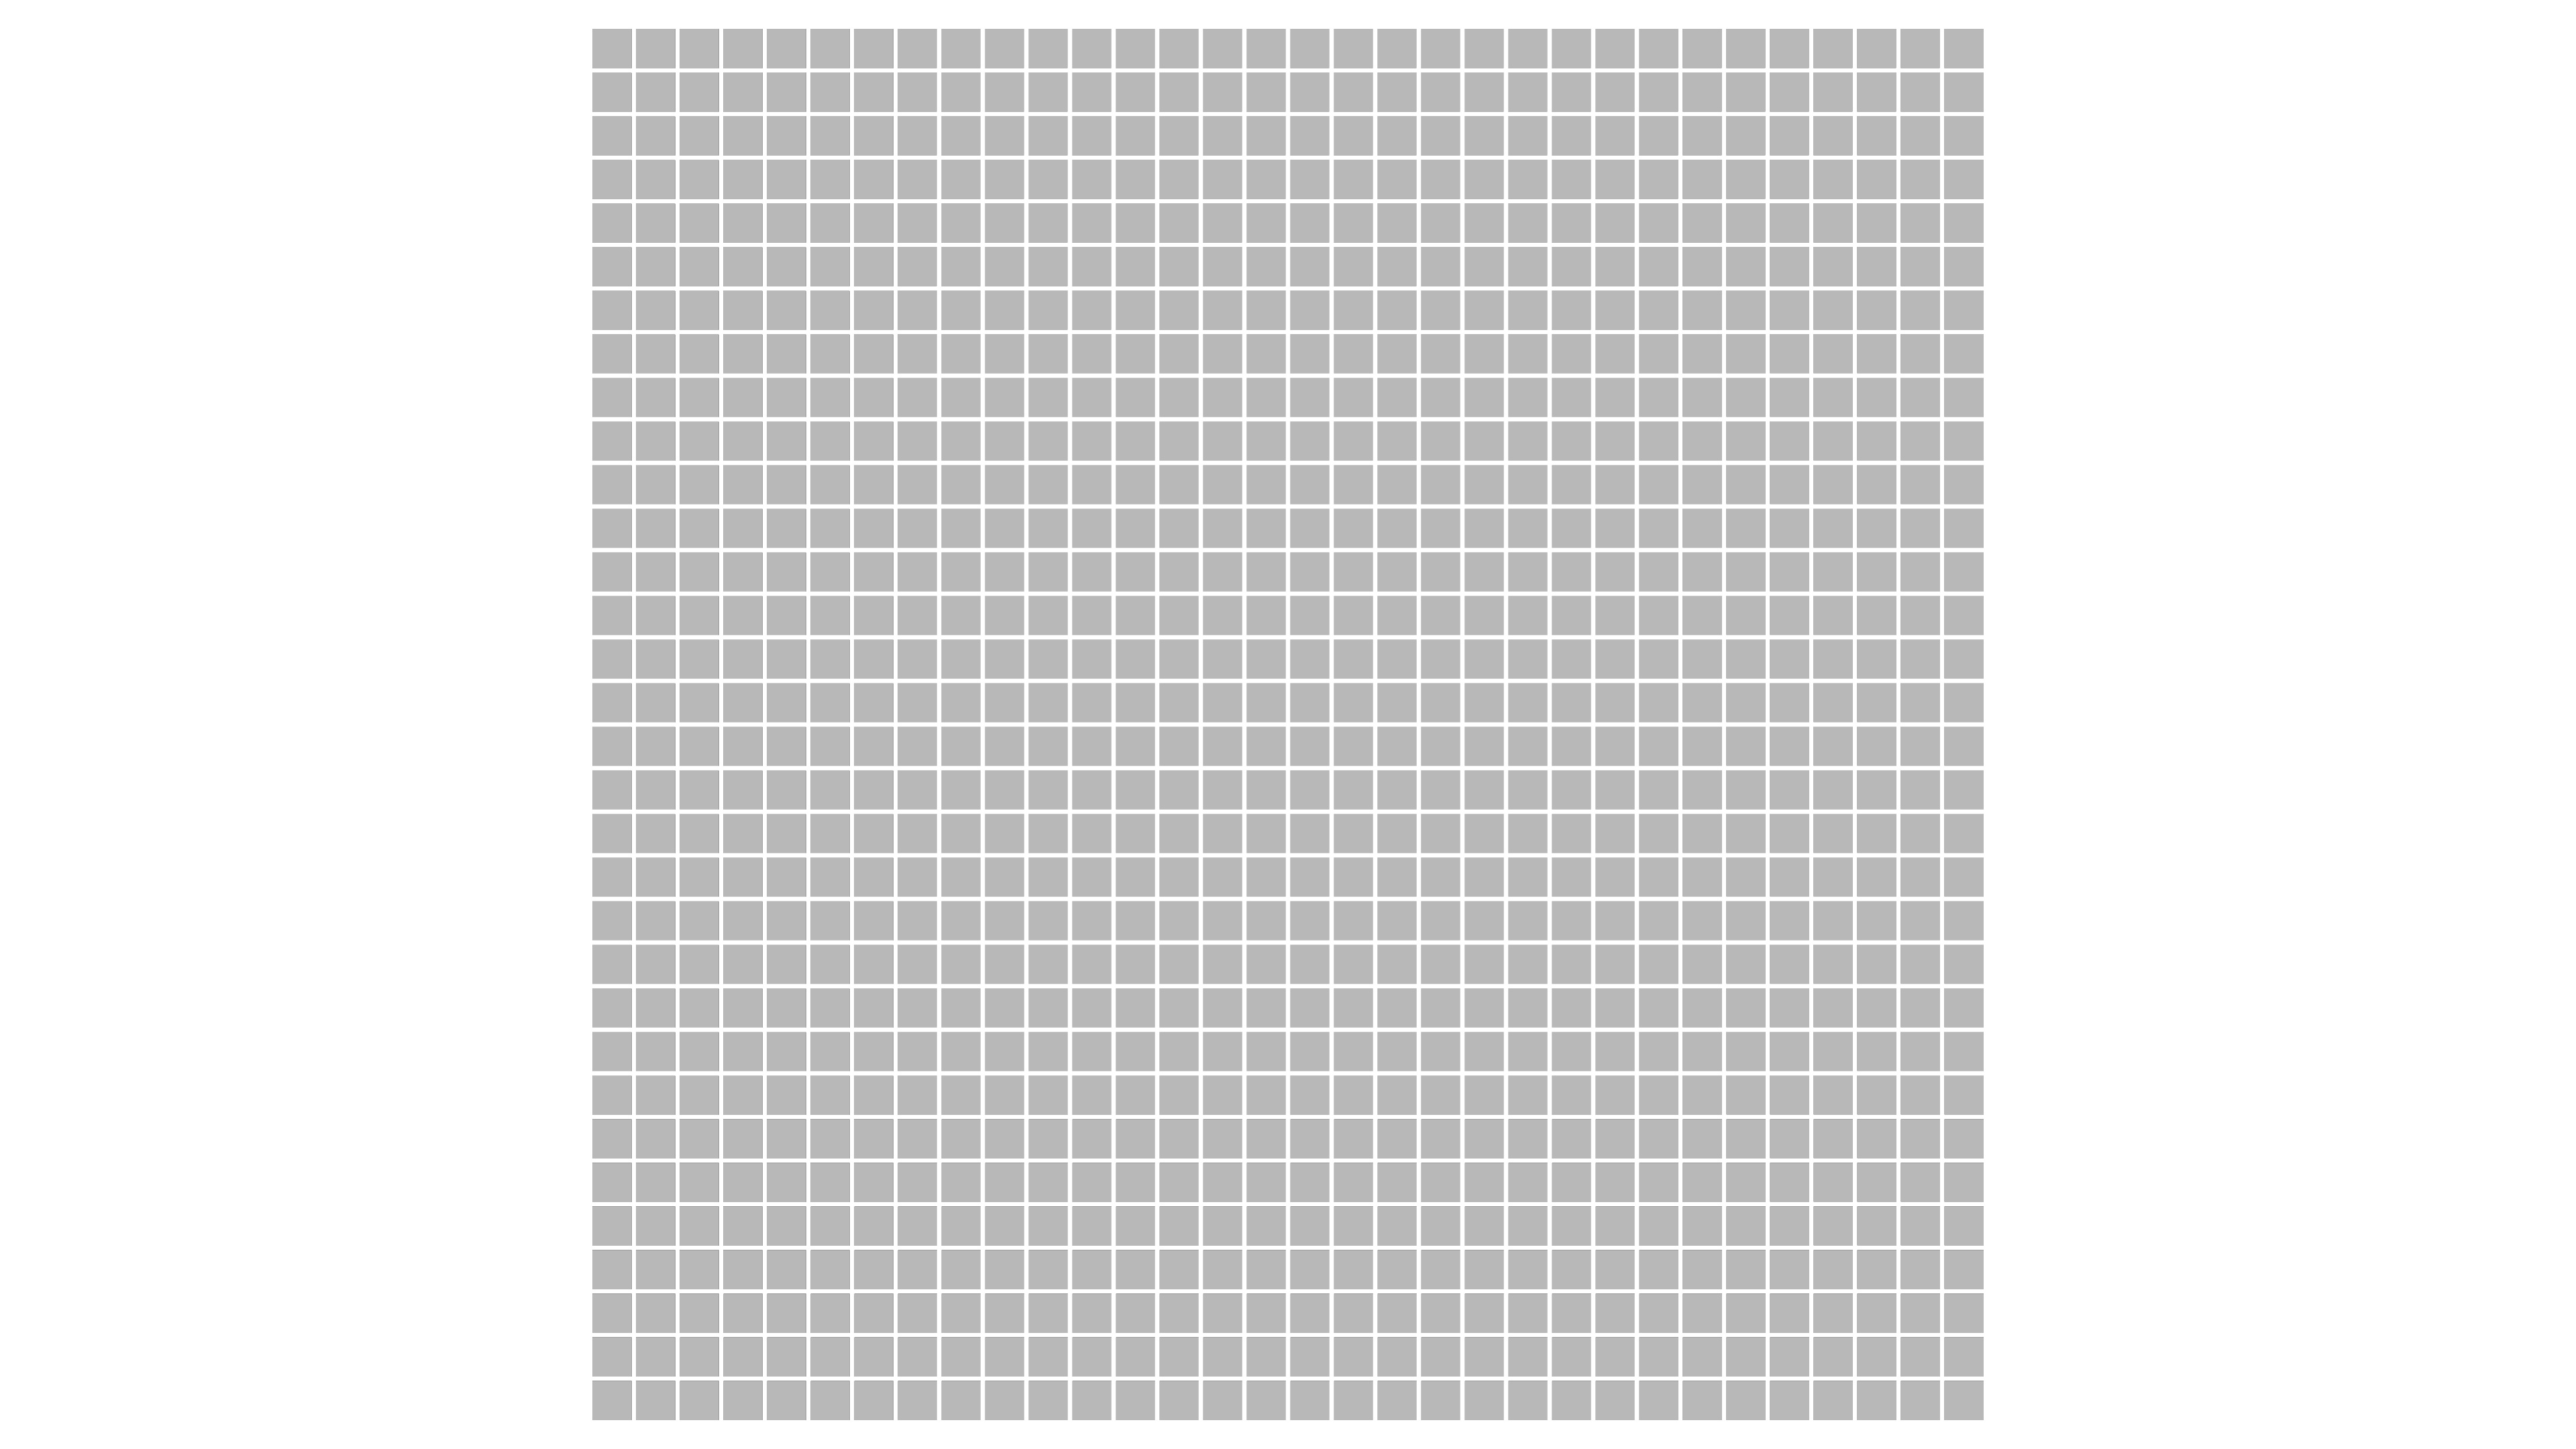
Selections can be made using grid divisions along the axes, using grid cells, or using labels.
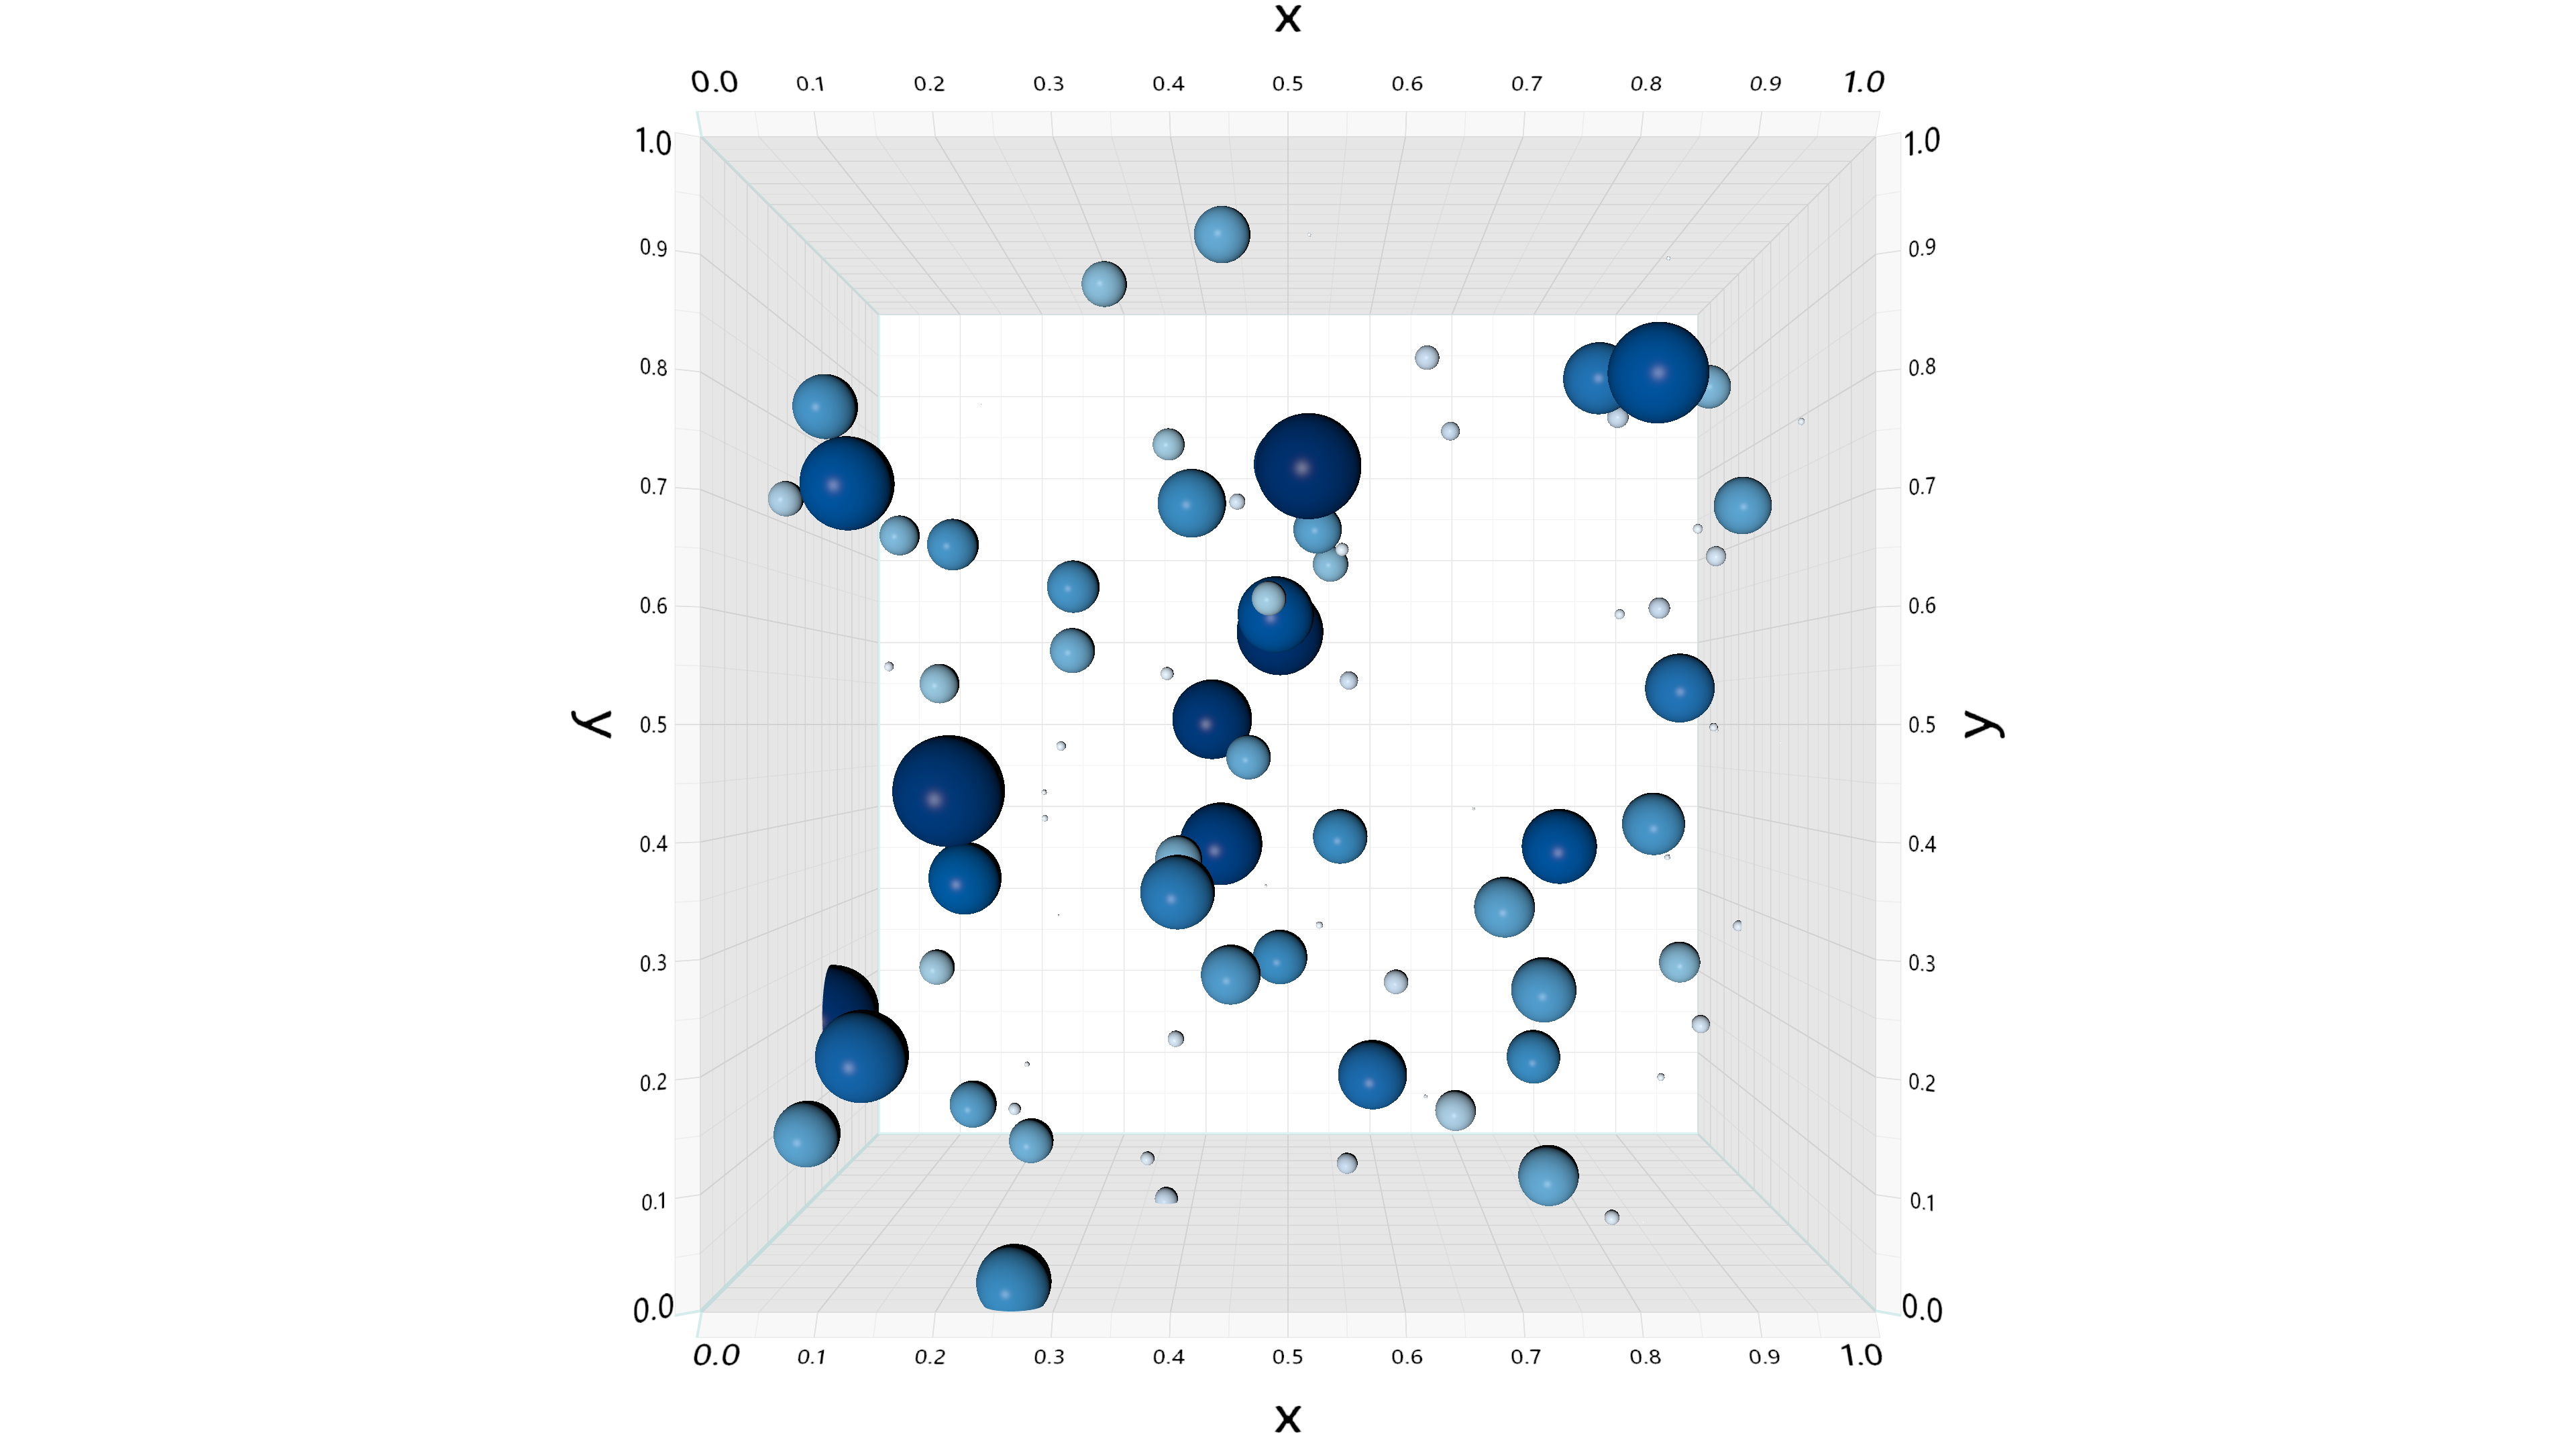
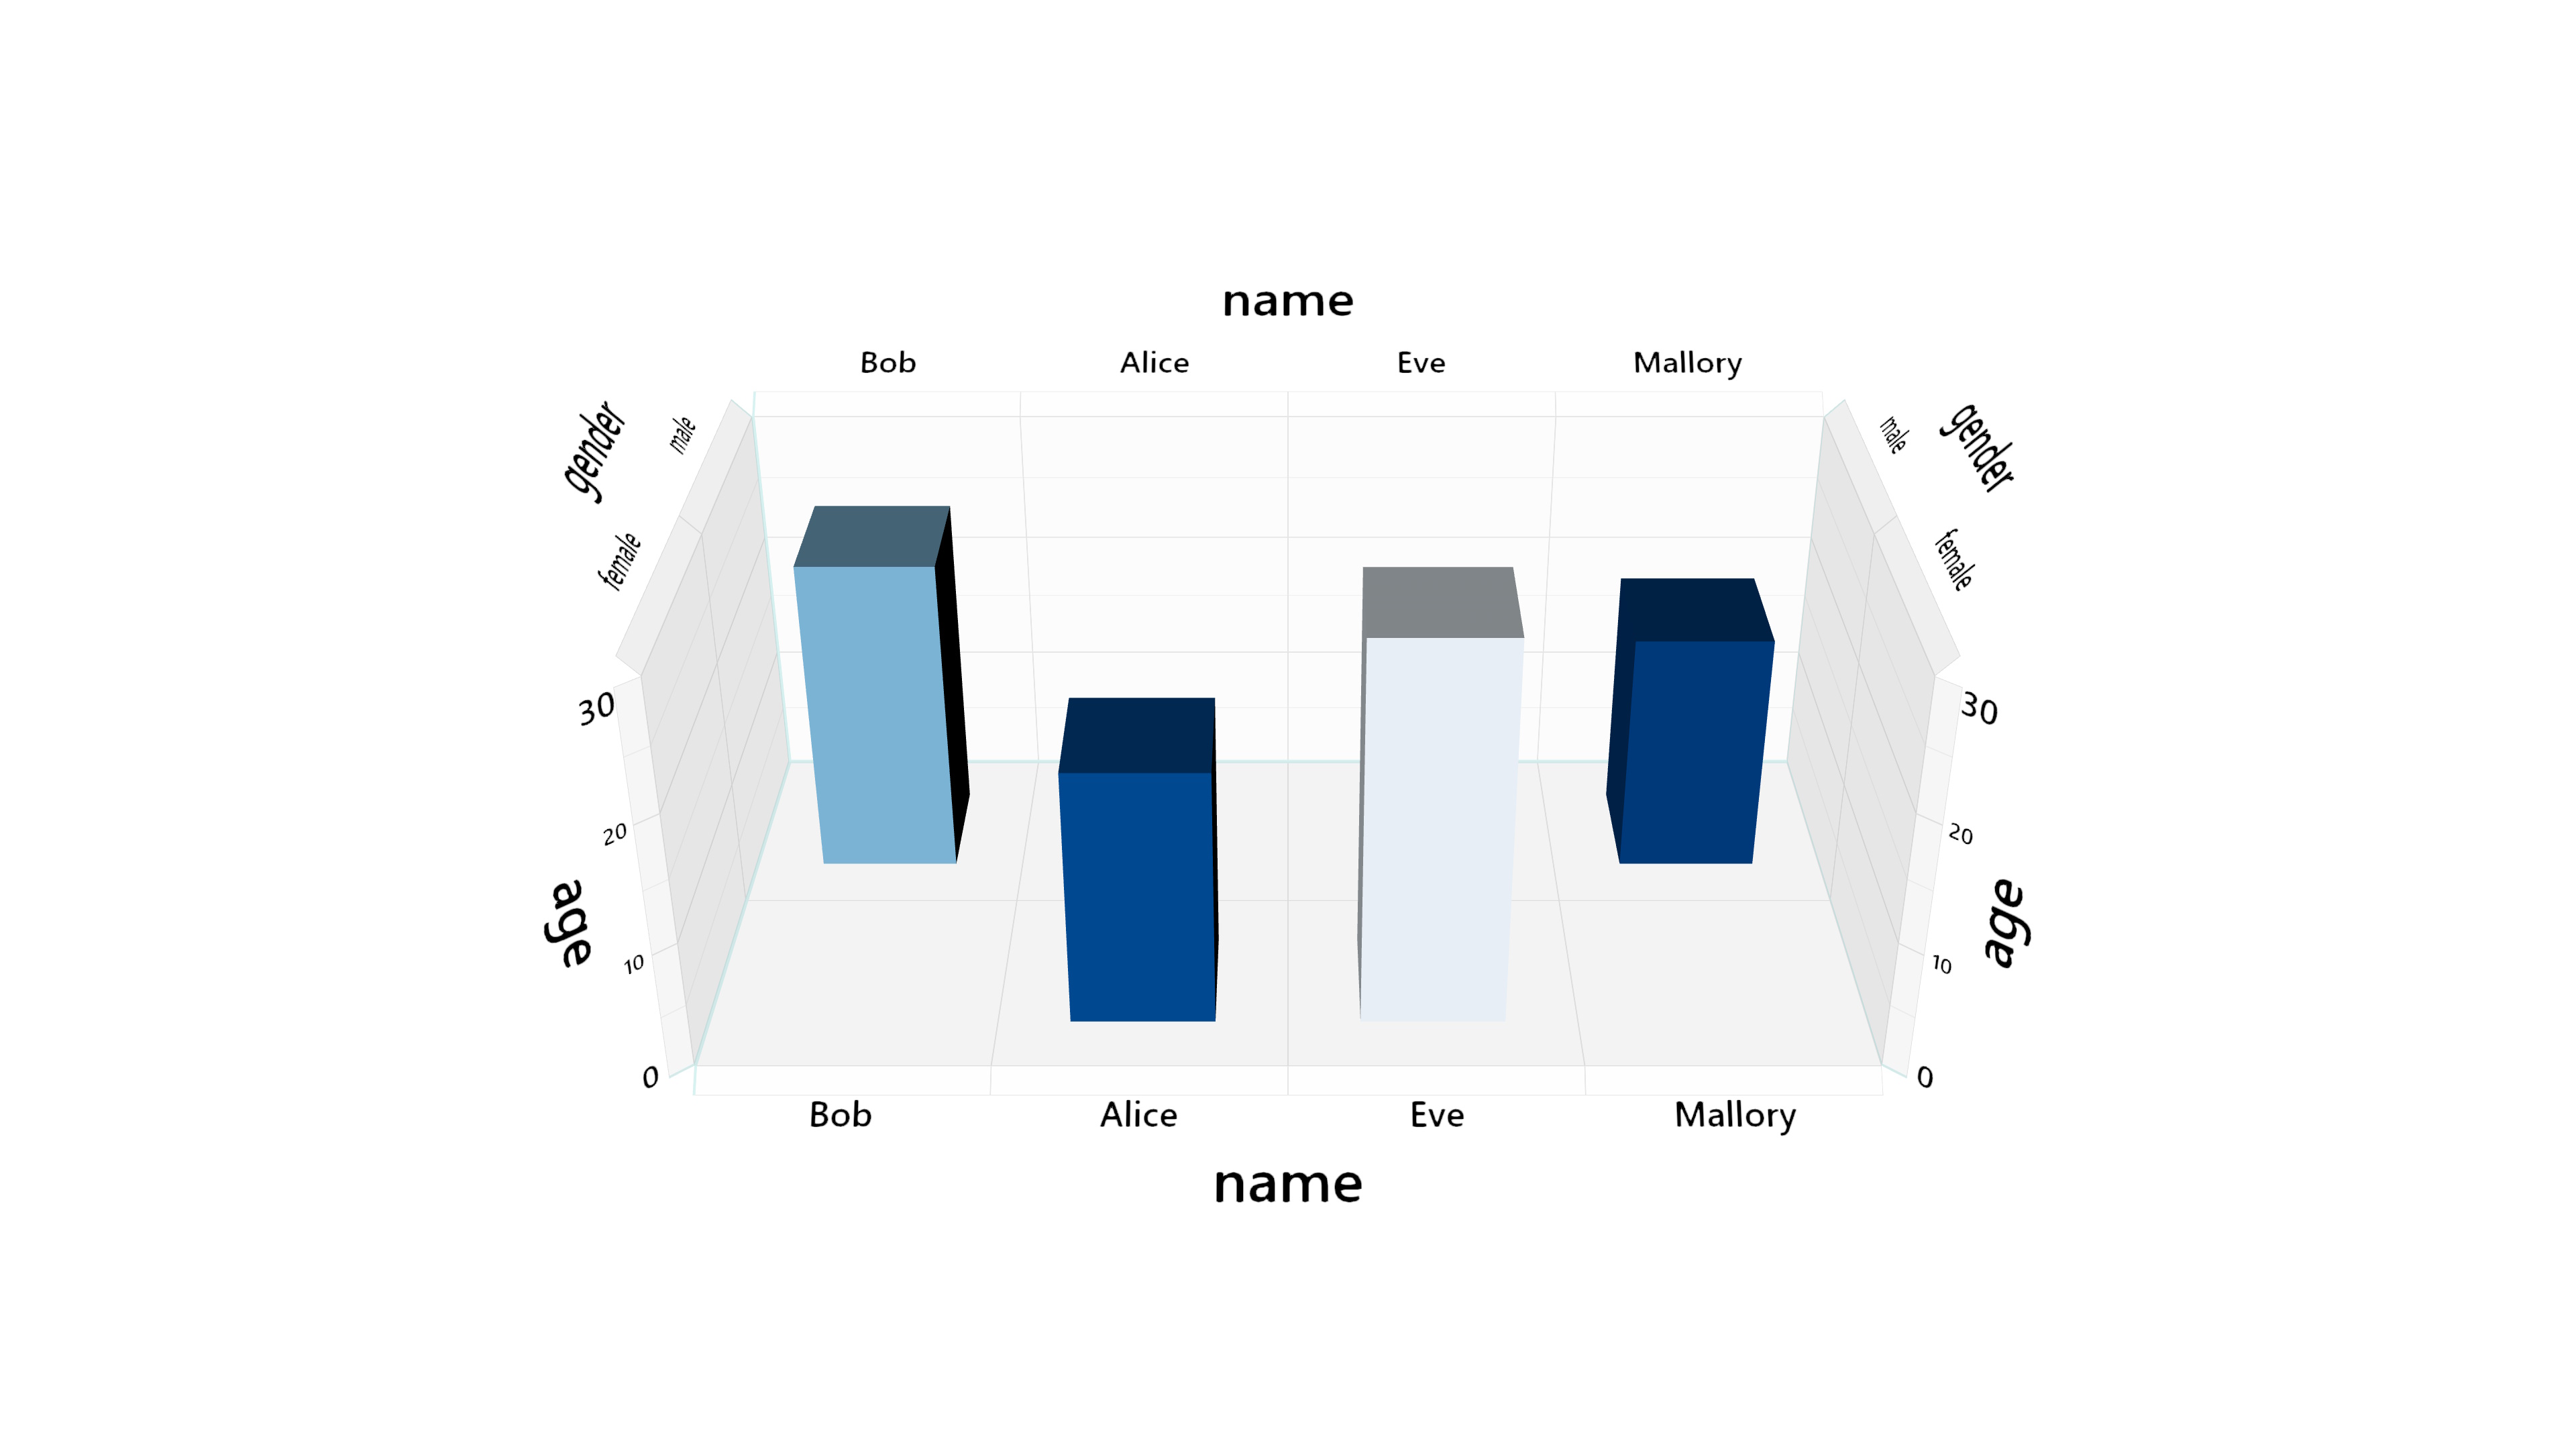
3D axes dynamically adapt the text orientation and edge visibility to the viewing angle.
Helper functions are provided for working with delimited (CSV) text files, however clients are free to load data from any data source.
A data-table abstraction is provided for:
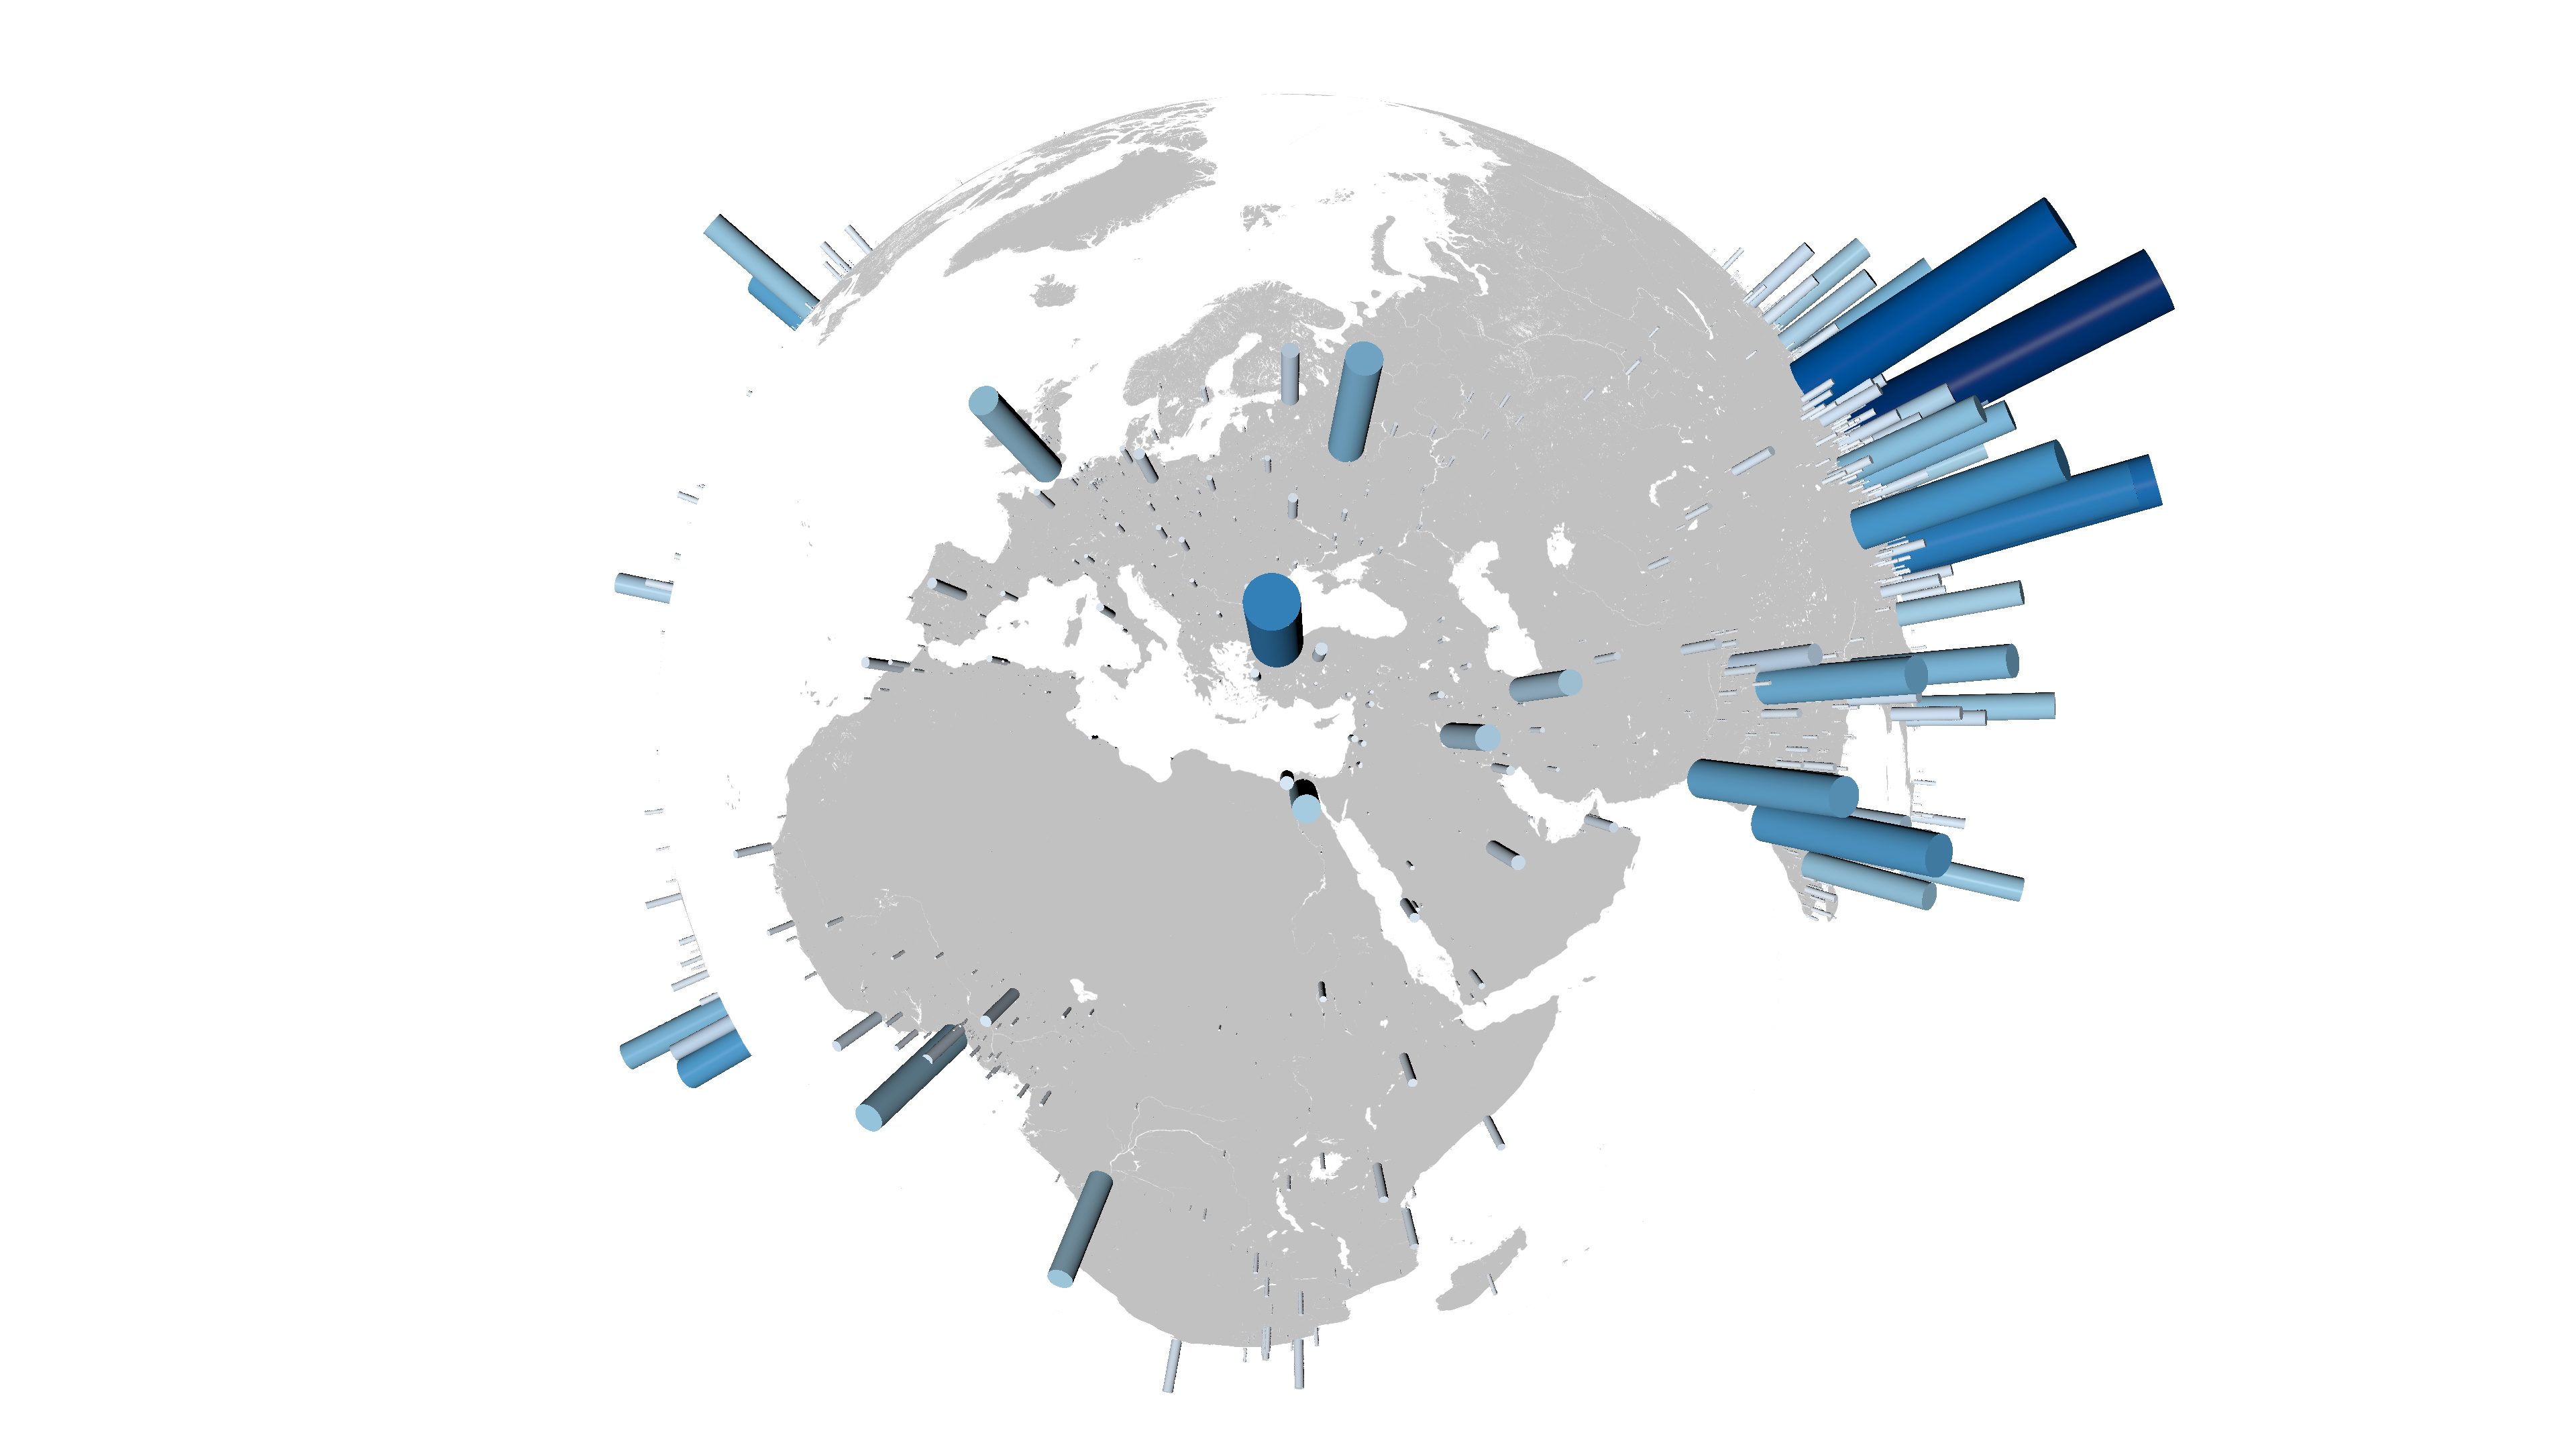
Background images, such as maps, can be added to provide context. Images can be rectangular or spherical.
Labels can be added individually or in groups for higher performance.
Support for immersive experiences with virtual reality headsets and controllers is supported via WebXR in the basic renderer.
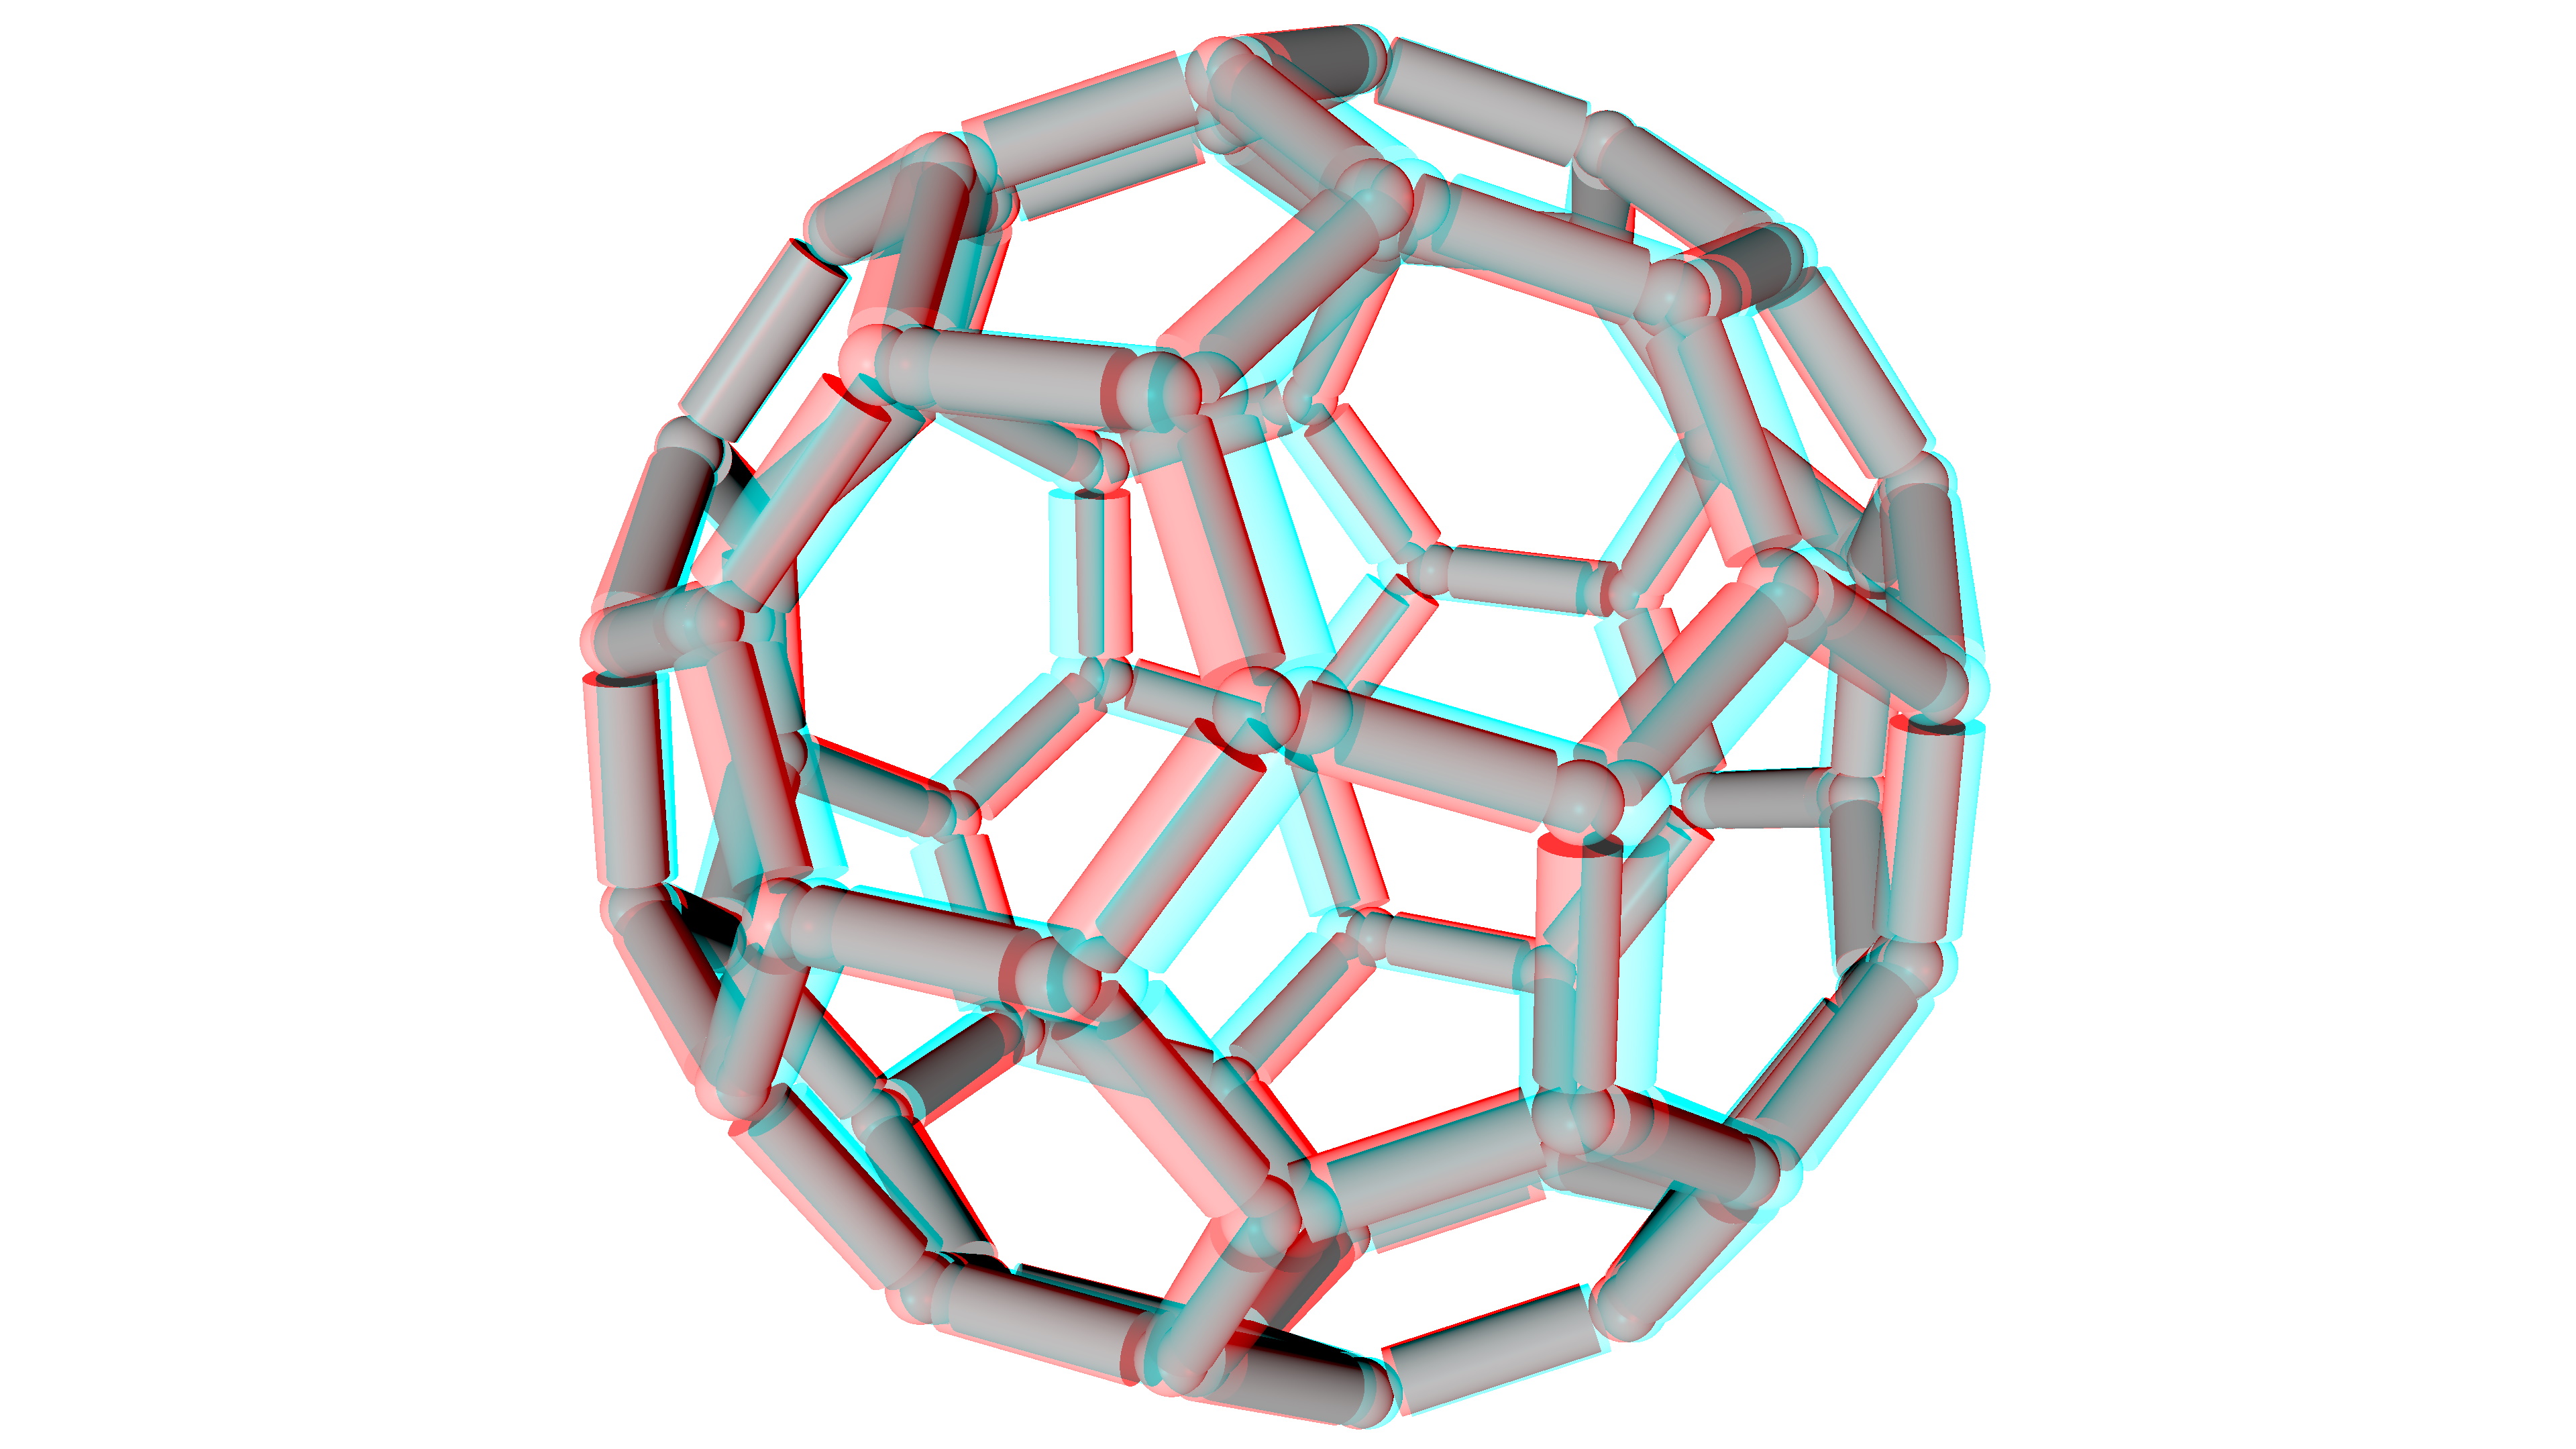
Stereo rendering is supported in the basic renderer with left, right, split-screen and anaglyph modes.
MoprhCharts is a low-level JavaScript library. The recommended way to consume the library is using TypeScript and importing the library from npm. The TypeScript declaration files will provide IntelliSense in development tools such as Visual Studio Code.
The following examples are presented as plain JavaScript with an ES6 import of the library from a CDN, so
they can be run directly without a bundler. Note that for the purposes of simplicity, the samples
occasionally use different types from the TypeScript declaration files (for example, Array
instead of glMatrix.vec3).
MorphCharts uses right-hand coordinates, so if the x-axis is to the right and the y-axis is up, the
z-axis is towards the viewer. 2D layouts and axes use the x-axis and y-axis. 3D layouts and axes add
the z-axis.
The key classes required to create a visualization are the A A renderer creates an HTML Canvas. To place this canvas in a specifc HTML Element, use the
If no The following examples render simple procedural data using different layouts and the basic renderer.
A layout is used to update the Line charts are created using multiple cylindrical line segments. Charts can be faceted by providing a set of facet ids and layout offsets. Helper functions are provided for binning and layout (wrapped or 1D, 2D or 3D grid layout). If faceting is intended to alter the layout (e.g. for stacks, treemaps etc), layout can be called
per facet. Layouts will track the maximum dimensions across multiple Renderers are hot-swappable, but not all features are available in all renderers. For example, the
A default The basic and advanced renderers use palettes for applying color to units. A palette is simply an
array of RGBA values in the range [0,255]. Helper functions are provided for creating palettes, for
example by interpolating between RBG or HSV values, or by resampling a set of standard palettes. A renderer defines a set of Axes are not automatically aligned to chart layouts, but instead require the relevant coordinate
space to the specified using a set of bounds. Typically the calculated layout bounds can be used to
align the axes with the layout, or a manual set of bounds can be used to align the layout with the
axes. Labels can be added individually as a Similarly to axes and chart layouts, a Animation can be used to transition between chart layouts, with or without staggering. The Staggering can be applied during the layout's update pass using
Text is drawn using a dynamically generated SDF (signed distance field) font. The default font can be configured using the constructor options for the There are two main ways to work with data: The These arrays can then be passed to the In order to work with a subset of the When working with a subset of the data, there is always a choice of using the data range from
either the subset or
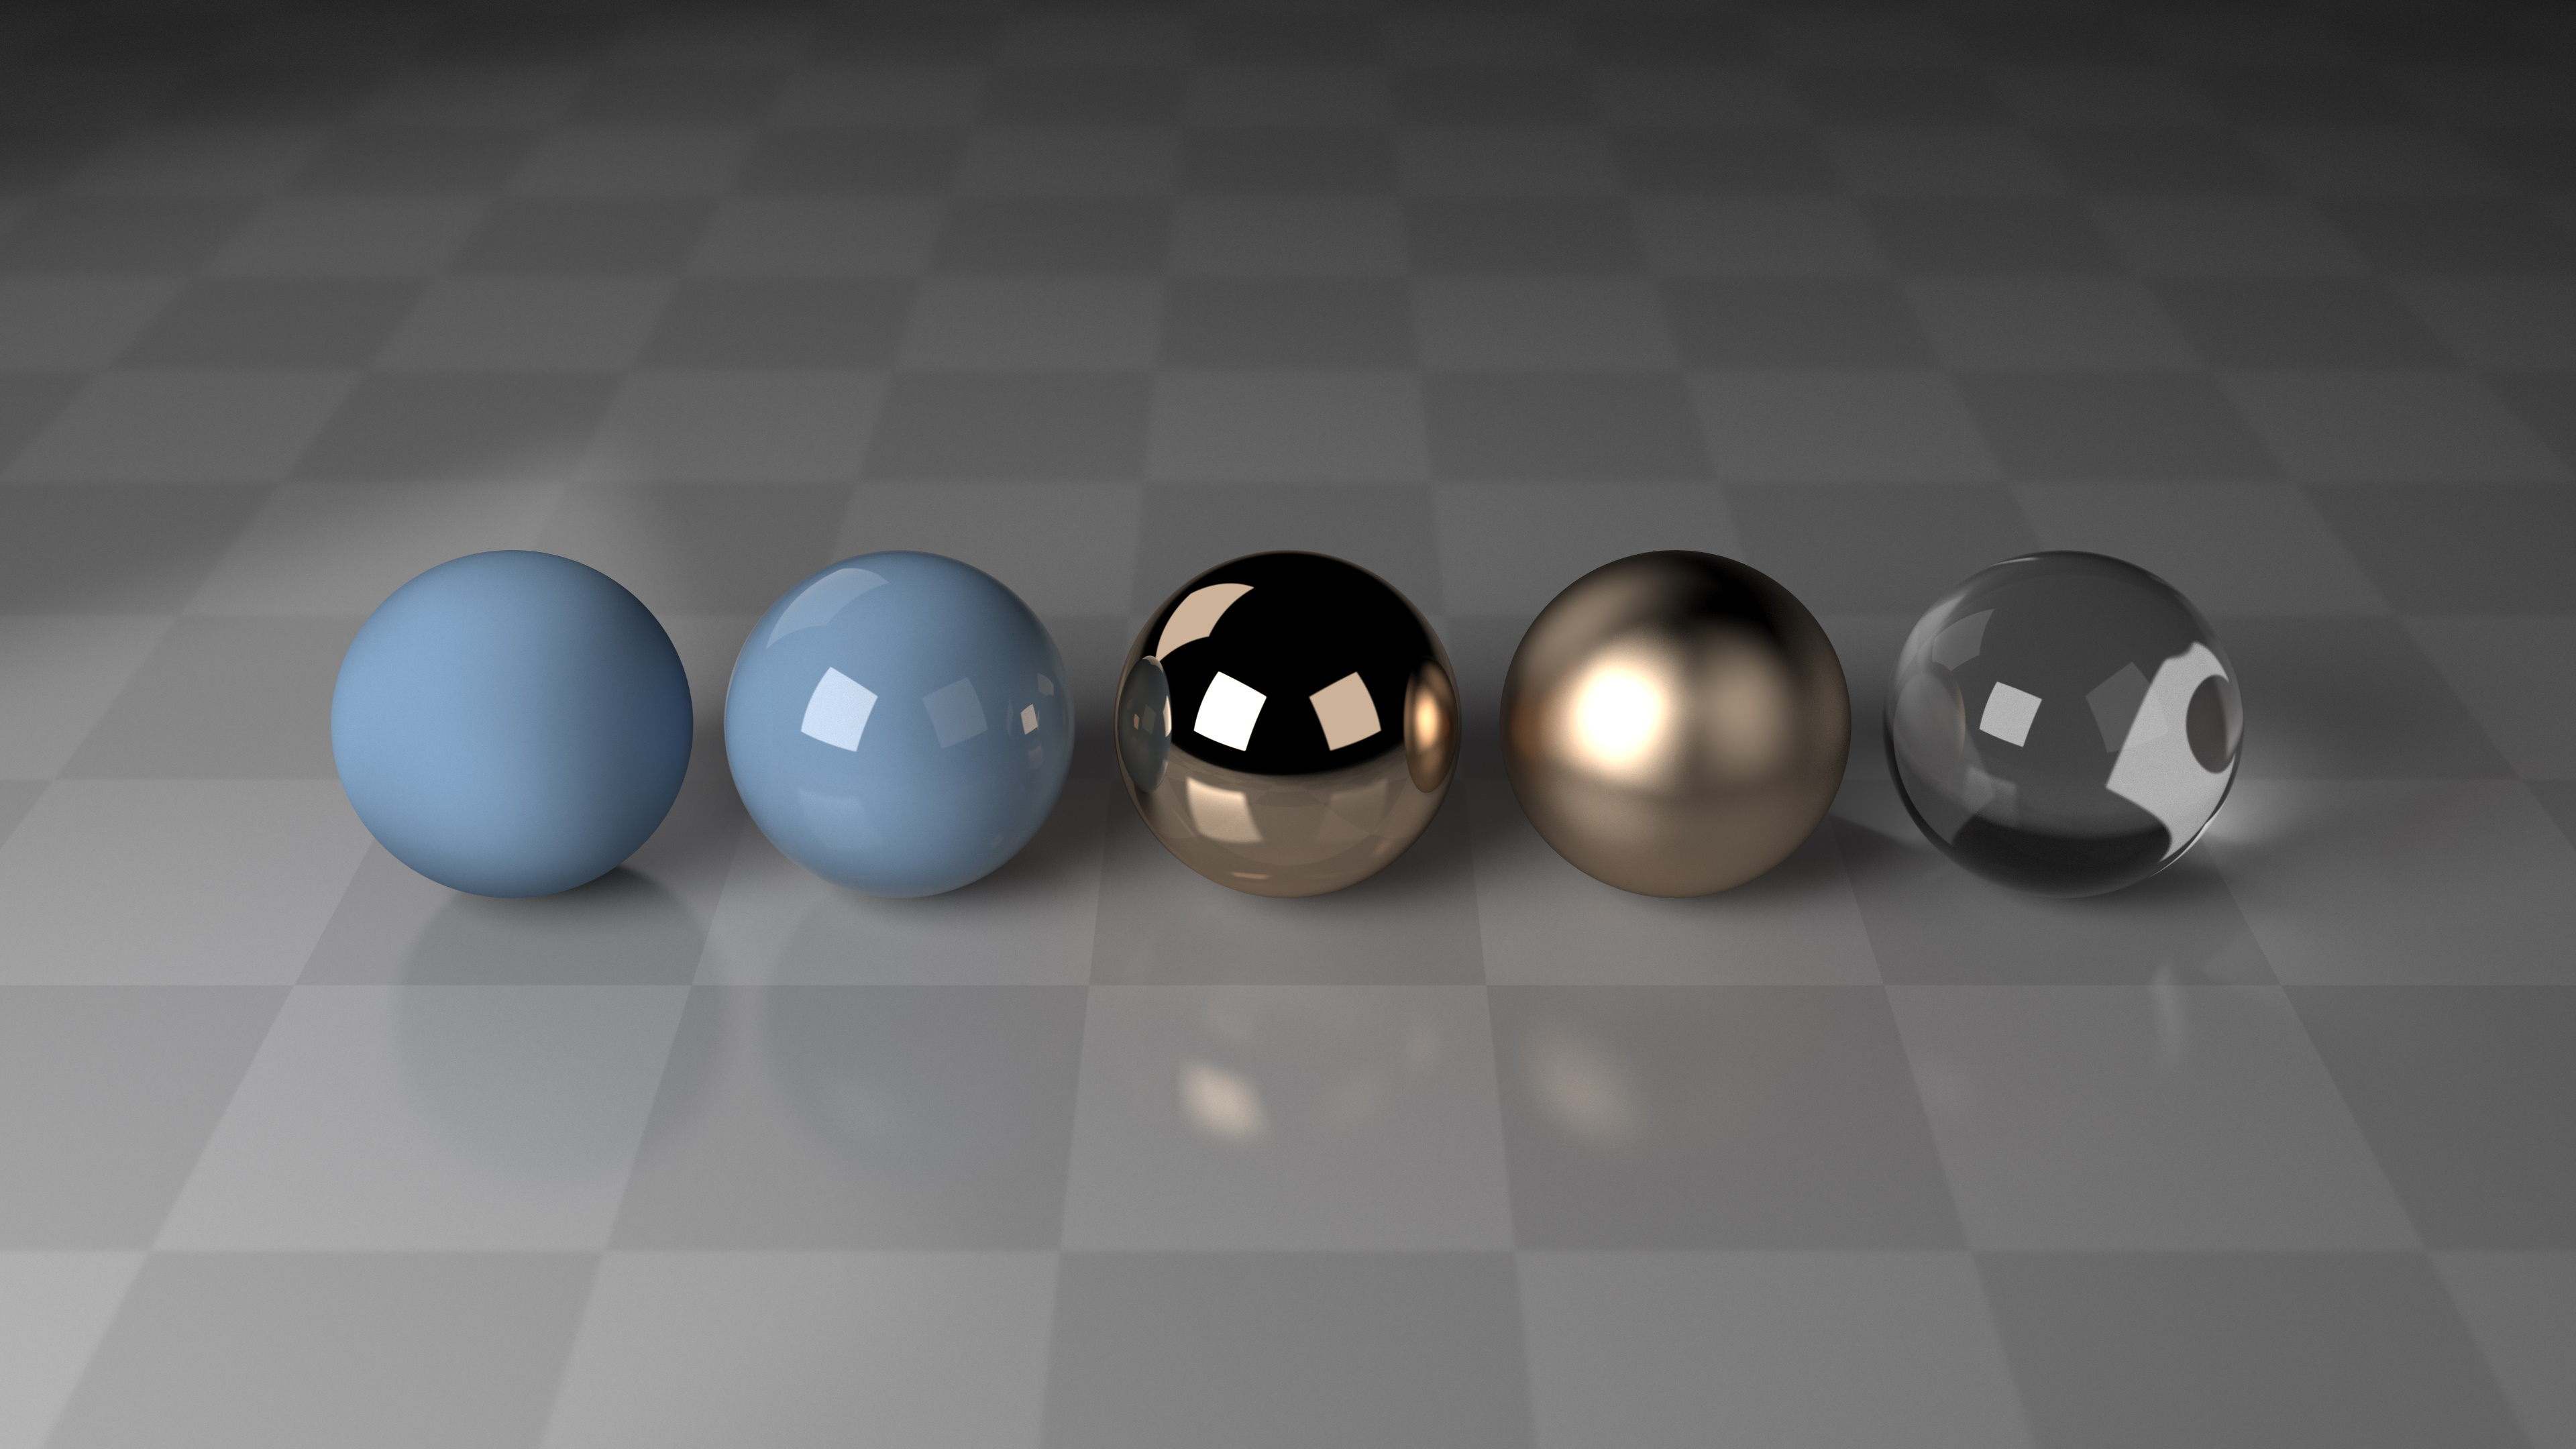
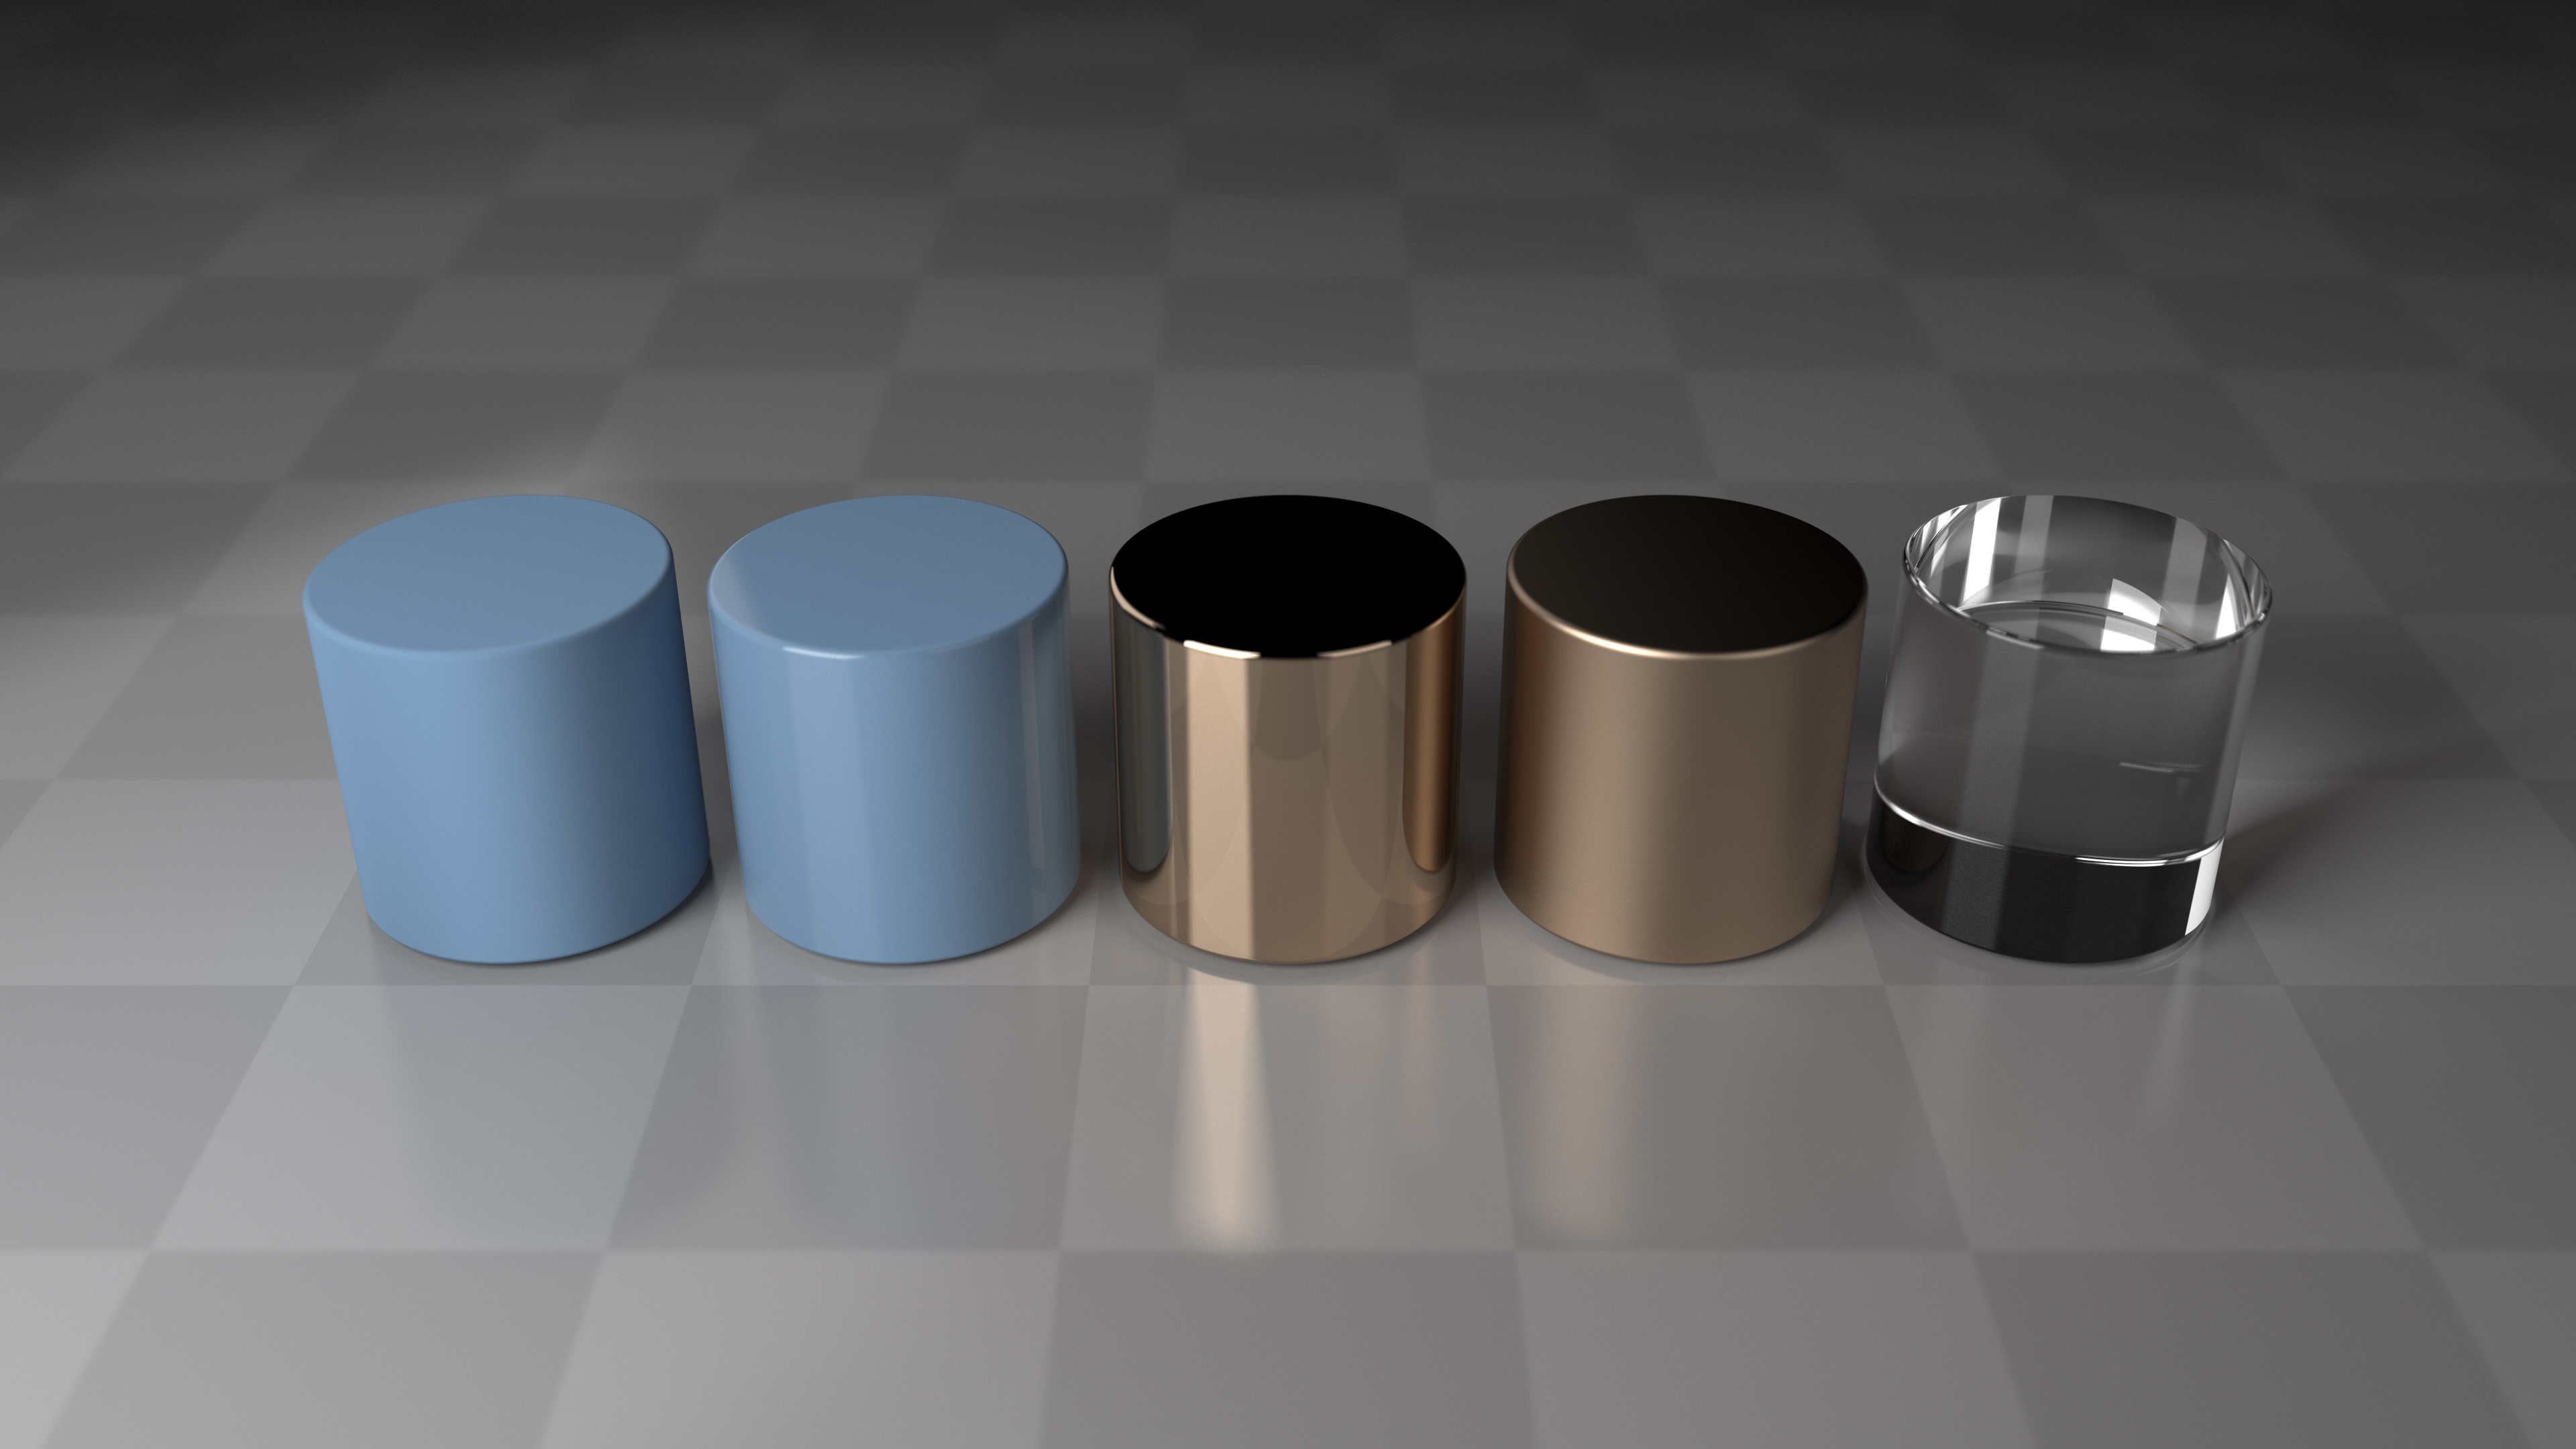
the entire table, such as for the axes and layout bounds, colors, and sizes etc. To maintain the original layout after filtering the data, use the entire Arrays can be used as an alternative to Whereas the basic and advanced renderers only support color, the raytrace renderer also supports
materials. This image shows (from left to right) Colored Glass Isotropic Materials The raytrace renderer also supports Signed Distance Field unit types, which can be used to add
rounded edges.
The raytrace renderer also supports motion blur. Information is written to the console according to the configured logging level. For more verbose
logging, set: In addition, interactive debug information can be gathered by setting: This information can then be written to an HTML element as follows:Coordinates
Initialization
Core, a renderer (e.g.
BasicRenderer), and a TransitionBuffer.
TransitionBuffer contains information for a specific number of
"units". Each unit could, for example correspond to a record in a tabular dataset. The
TransitionBuffer has a currentBuffer and previousBuffer, each
of which can be updated with independent positions, sizes, orientations, colors etc for each unit,
allowing an animated transition between views. This helps users maintain context and enables
animated data stories.
Core options container parameter. The size can be specified either in the
renderer width and height options, or on the HTML Element container
itself.
container is passed to the Core, the renderer will add the canvas to
the HTML Document and use the available space. In the following example, a style is added to ensure
the the height is 100%.Layouts
TransitionBuffer. Each layout has a layout()
and update() method which specify the buffer to use, an array of ids (which can in be a
specific order, or a subset of the TransitionBuffer's ids for faceted layouts), and a
set of options. layout() is used purely for calculating layout-related properties.
update() is used to update the GPU buffer, and includes any non-layout related
properties such as color, selection etc. This allows these properties to be updated without
re-calculating the layout.
layout() measures a set of bounds for each axis in the same units as the data (model
units).
update() will normalize these bounds to the range [0,1], such that the longest
dimension will be unit length. By default, update() will use the bounds measured in
layout(), however they can also be specified explicitly in the update()
options. This allows, for example alignment with specific ranges of axes, or with other layouts. A
modelPosition vector, scalar modelScale, and modelRotation
quaternion is then applied by the Core.
Scatter Plot
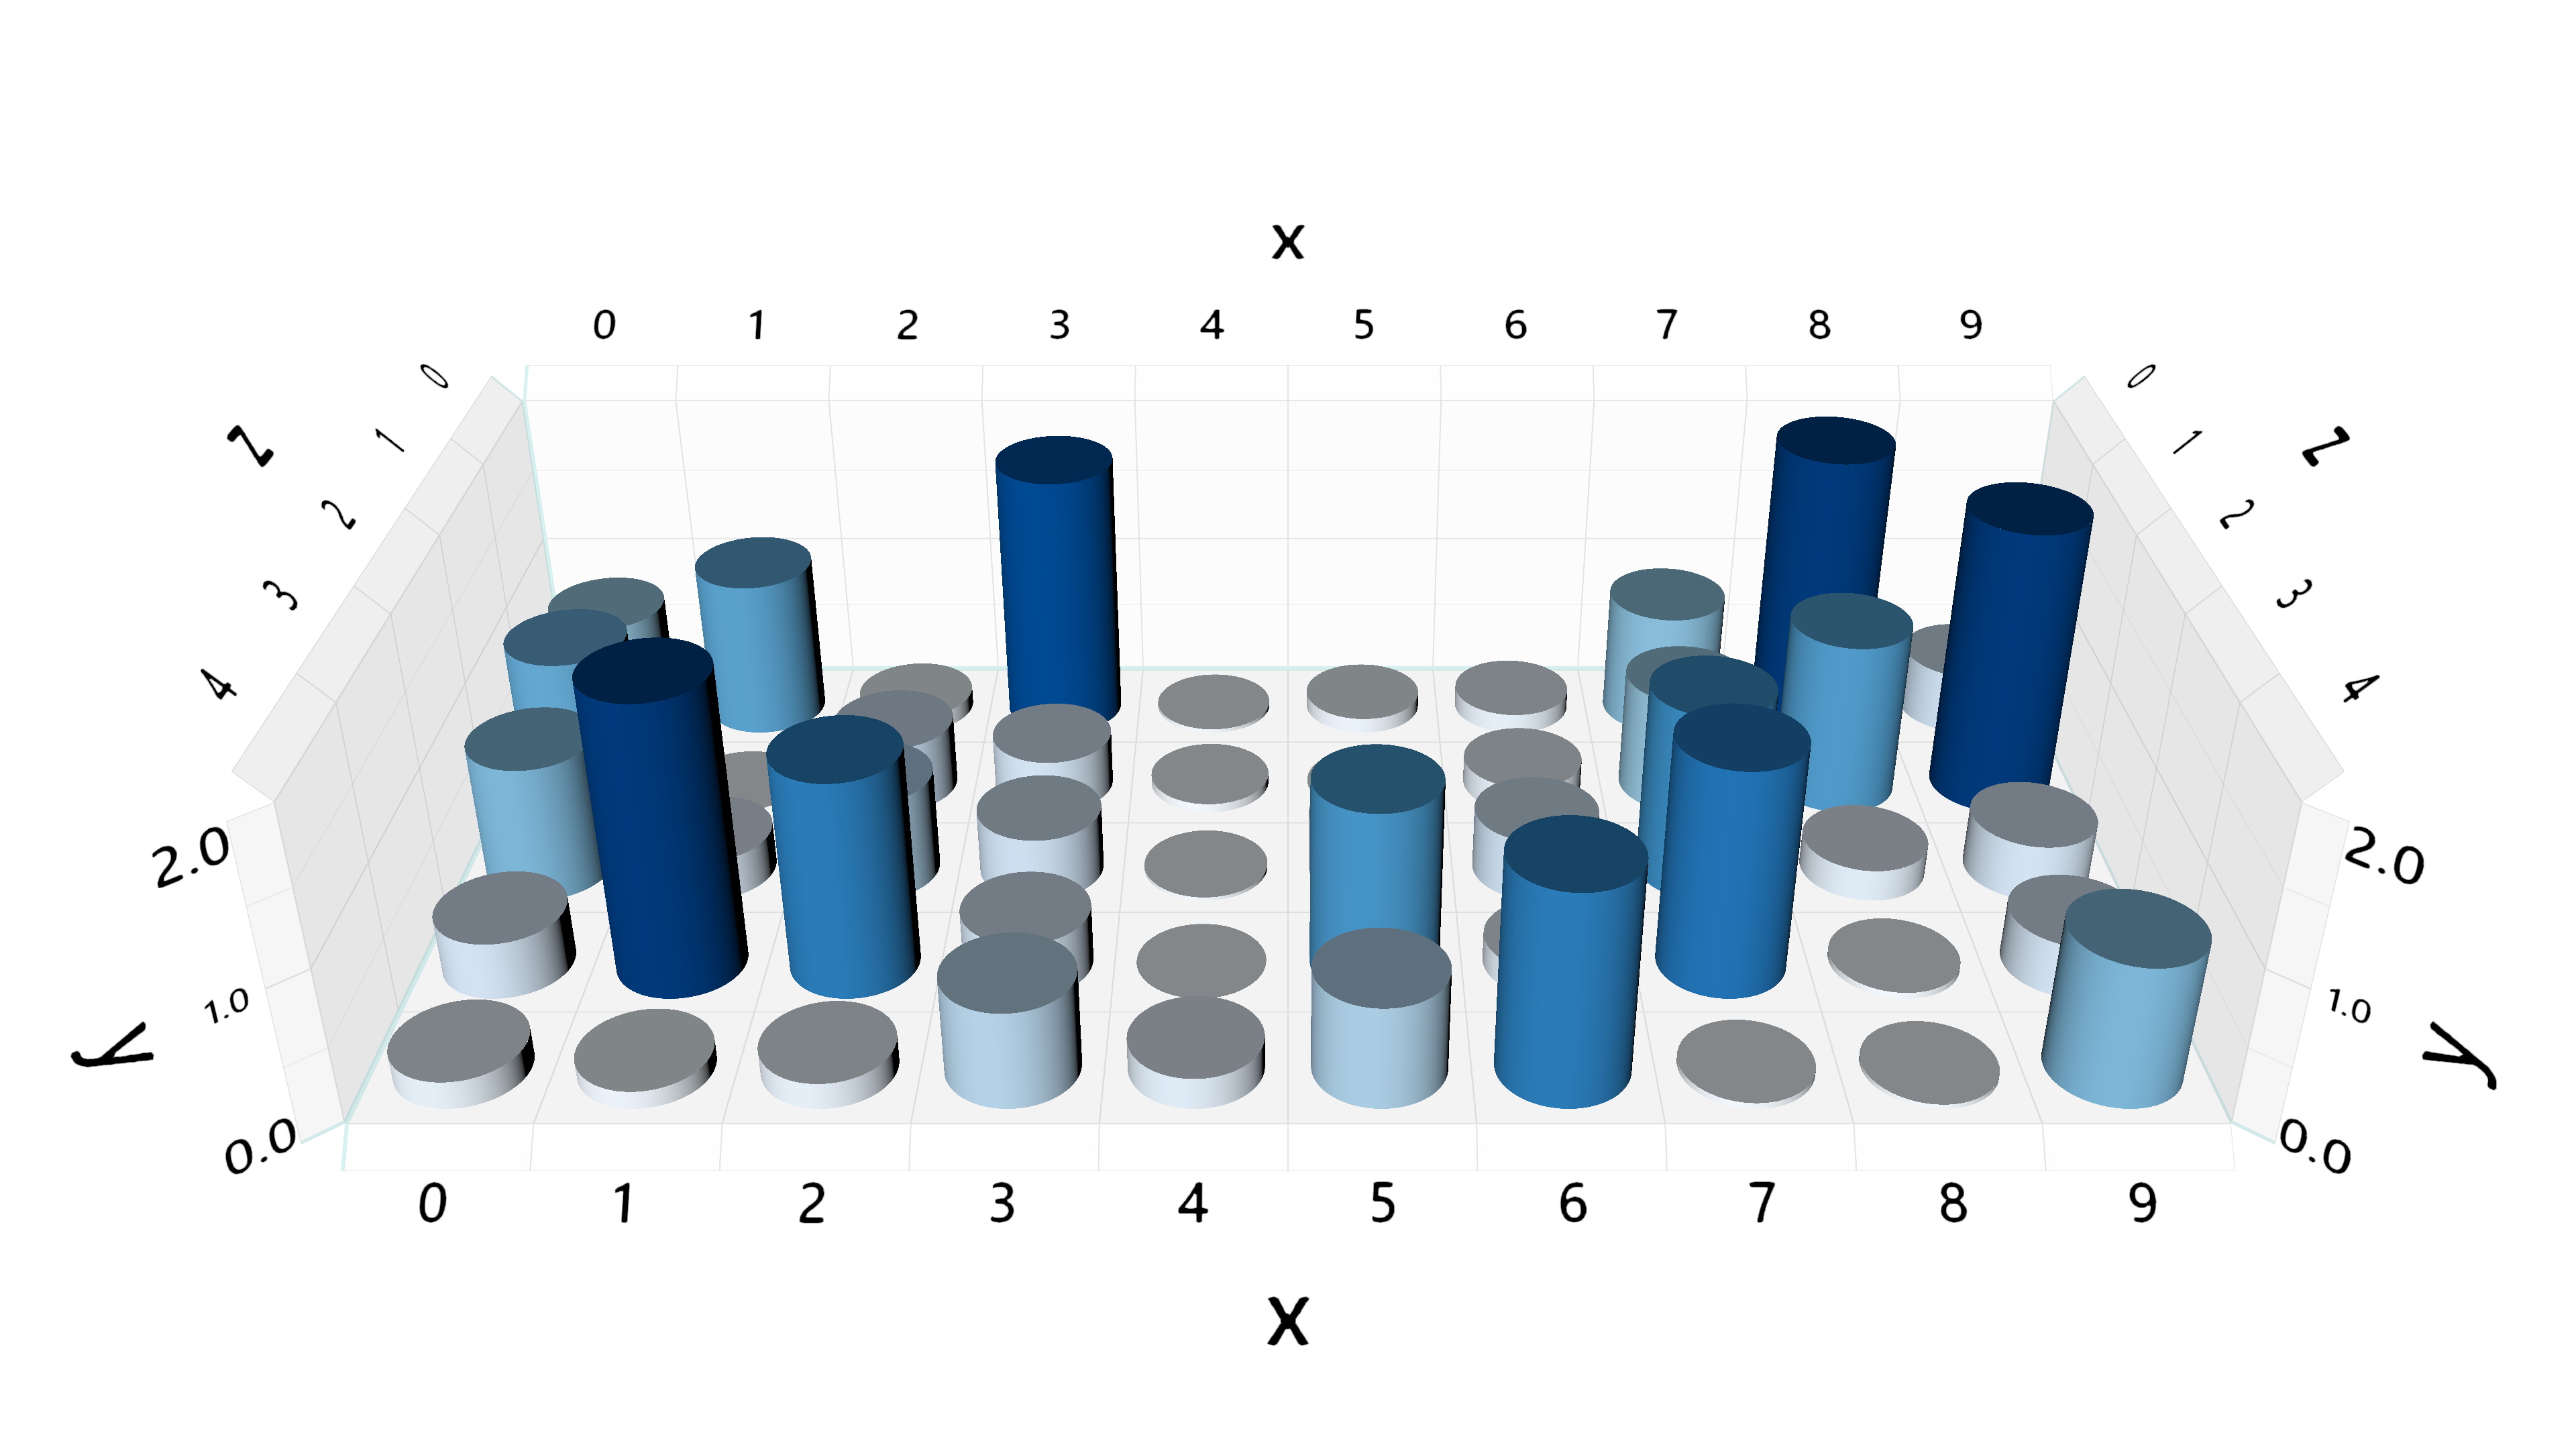
Bar Chart
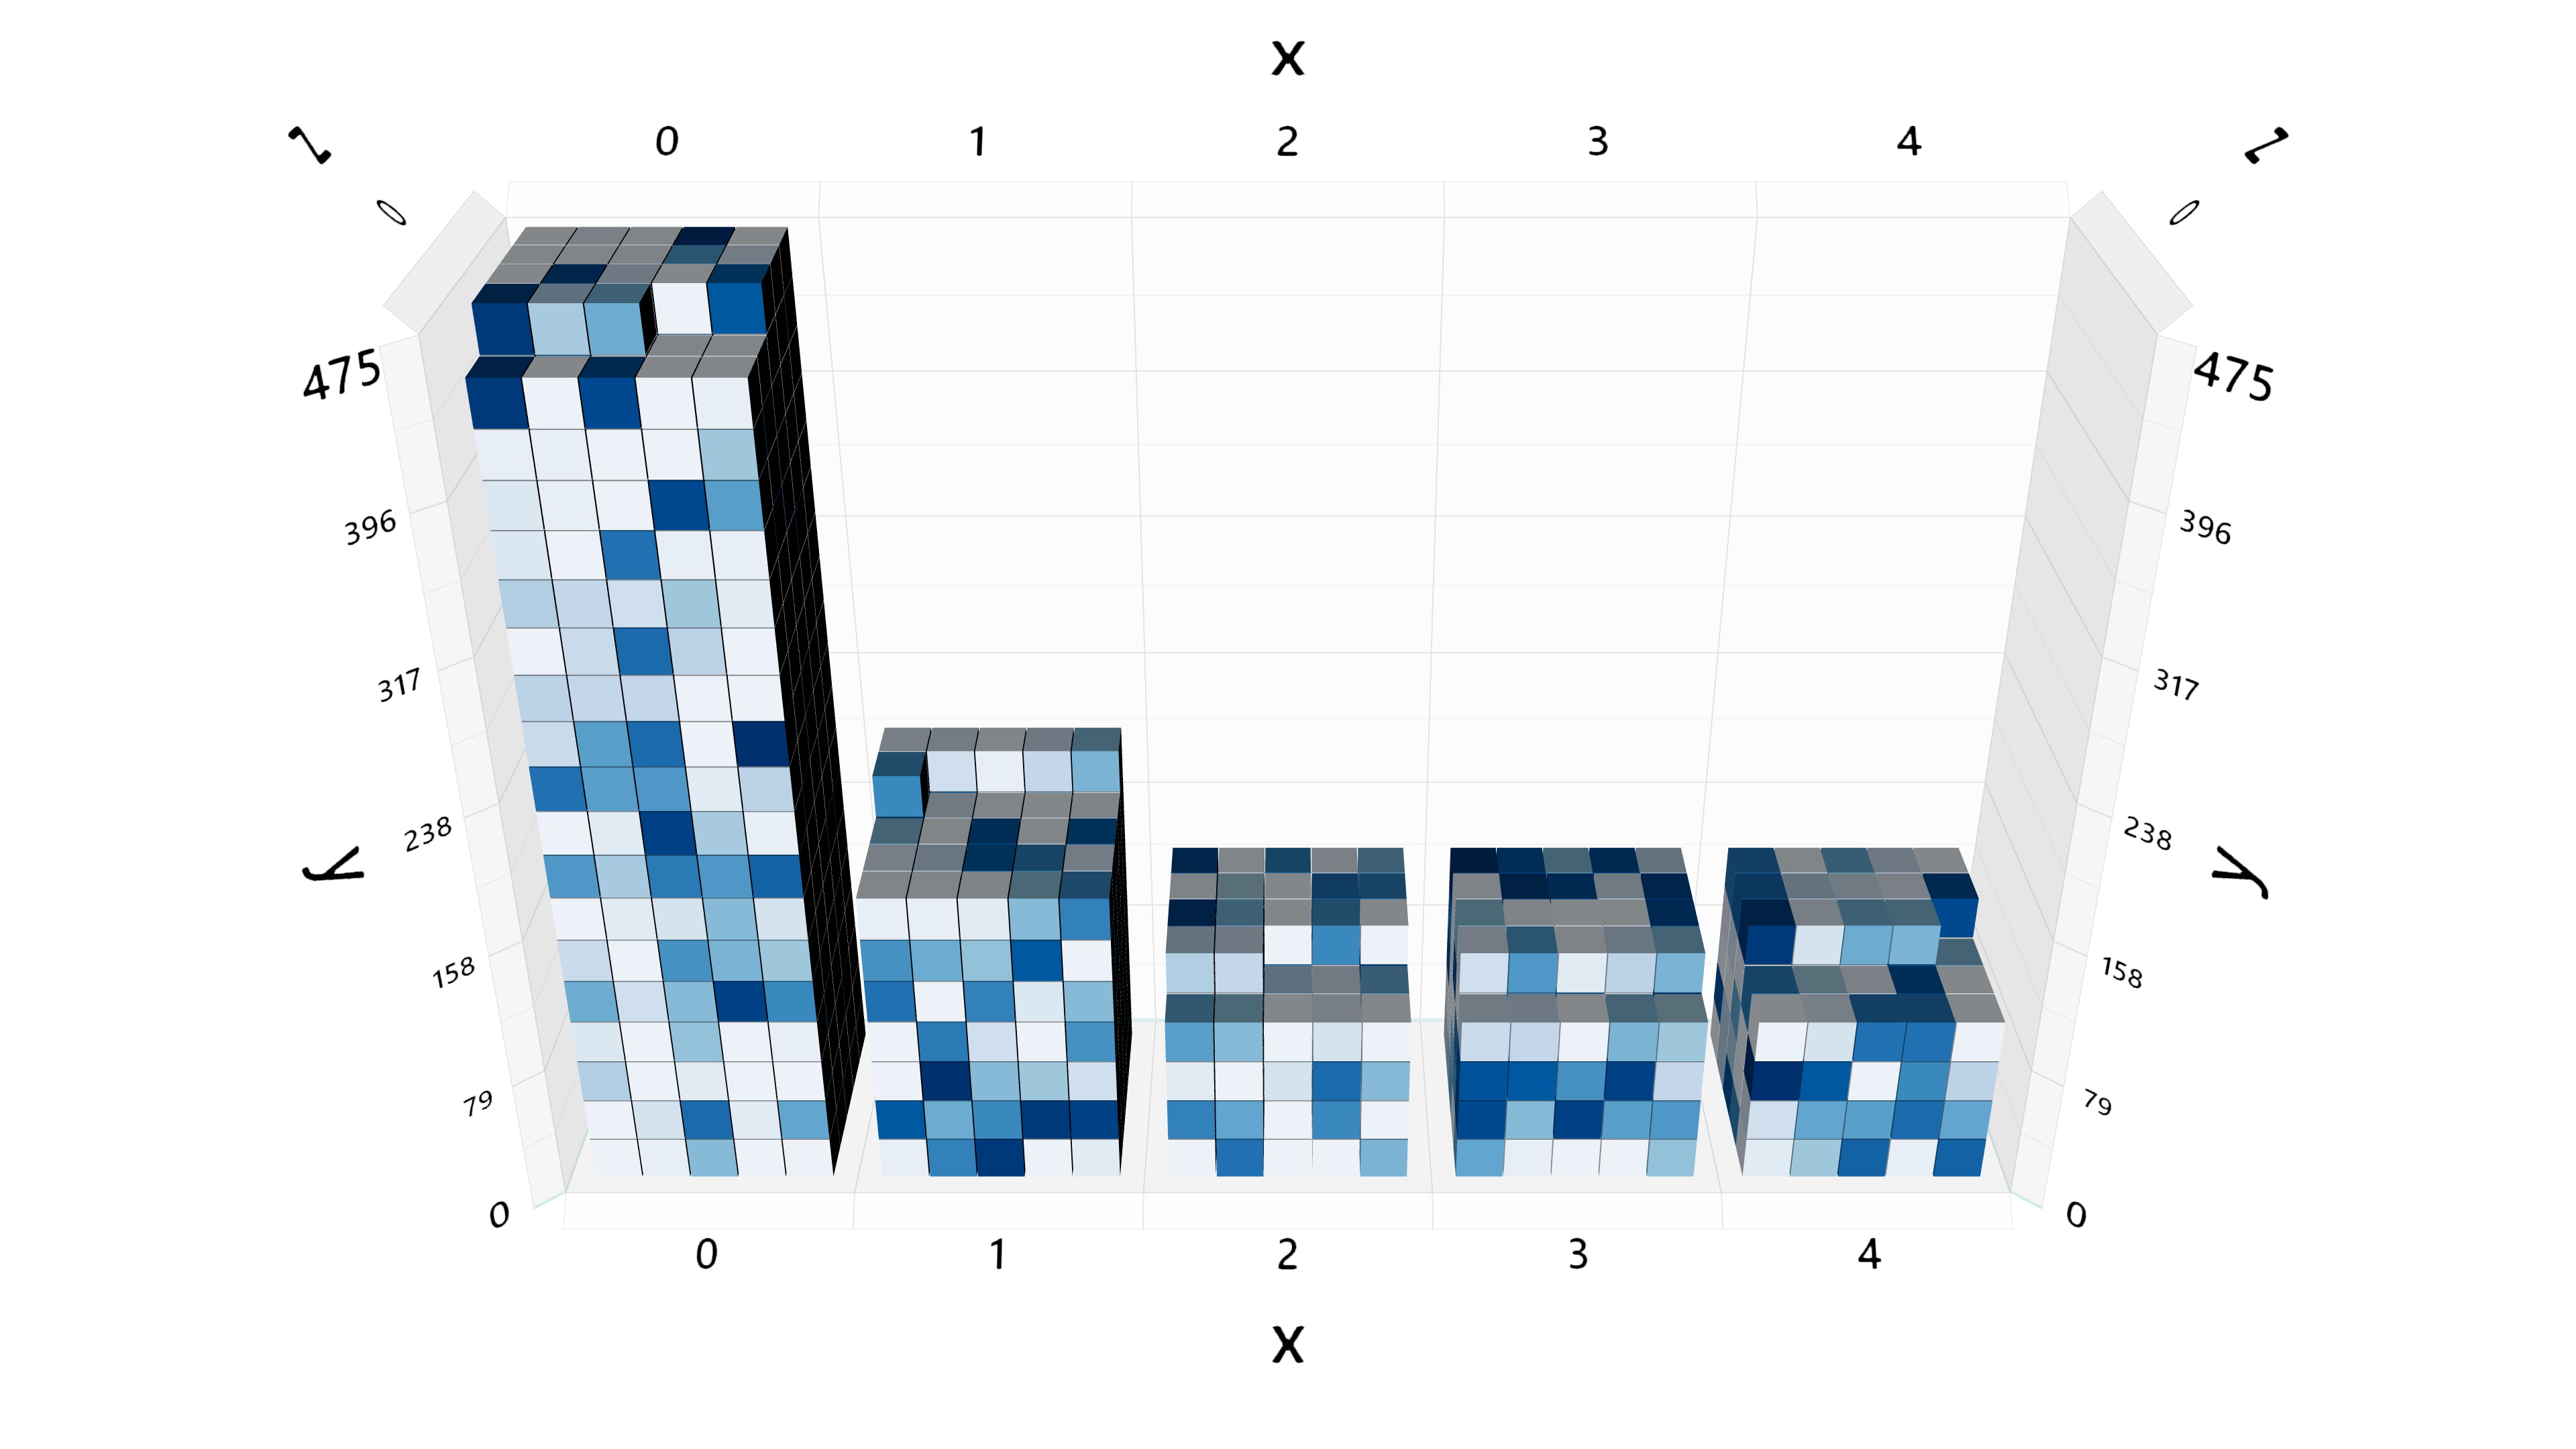
Stack Chart (Count)
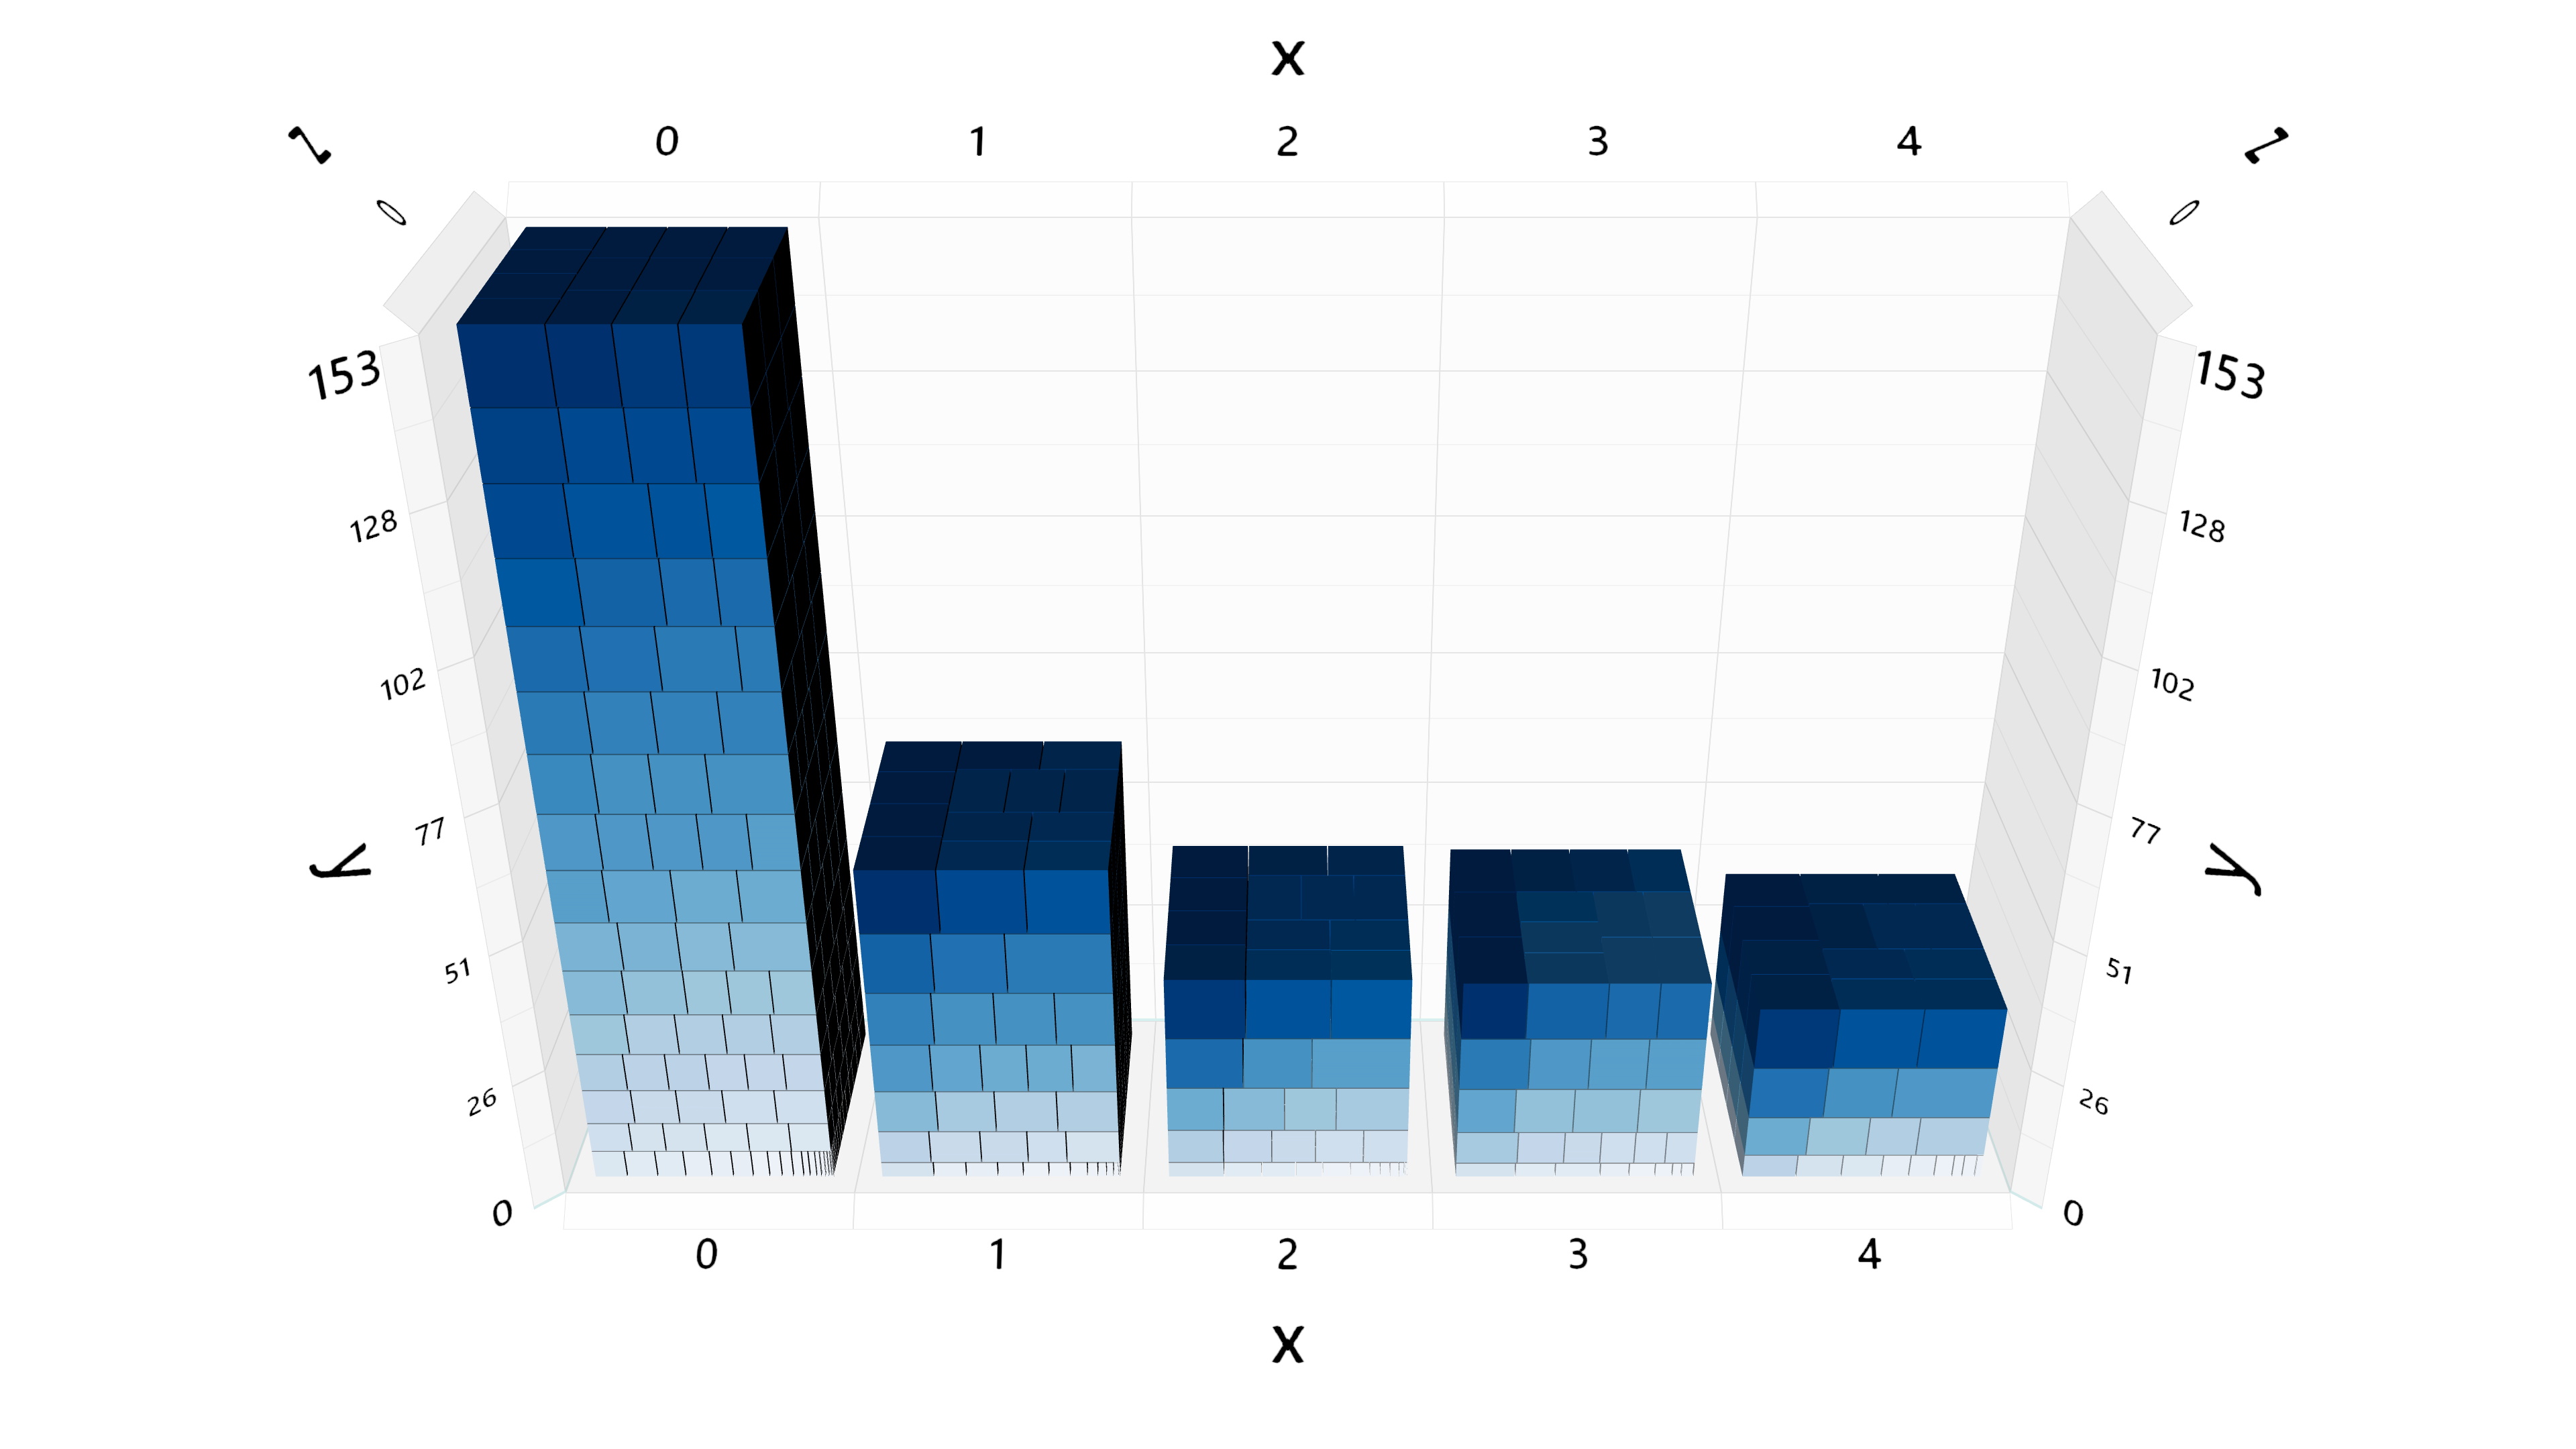
Stack Chart (Sum)
Groups
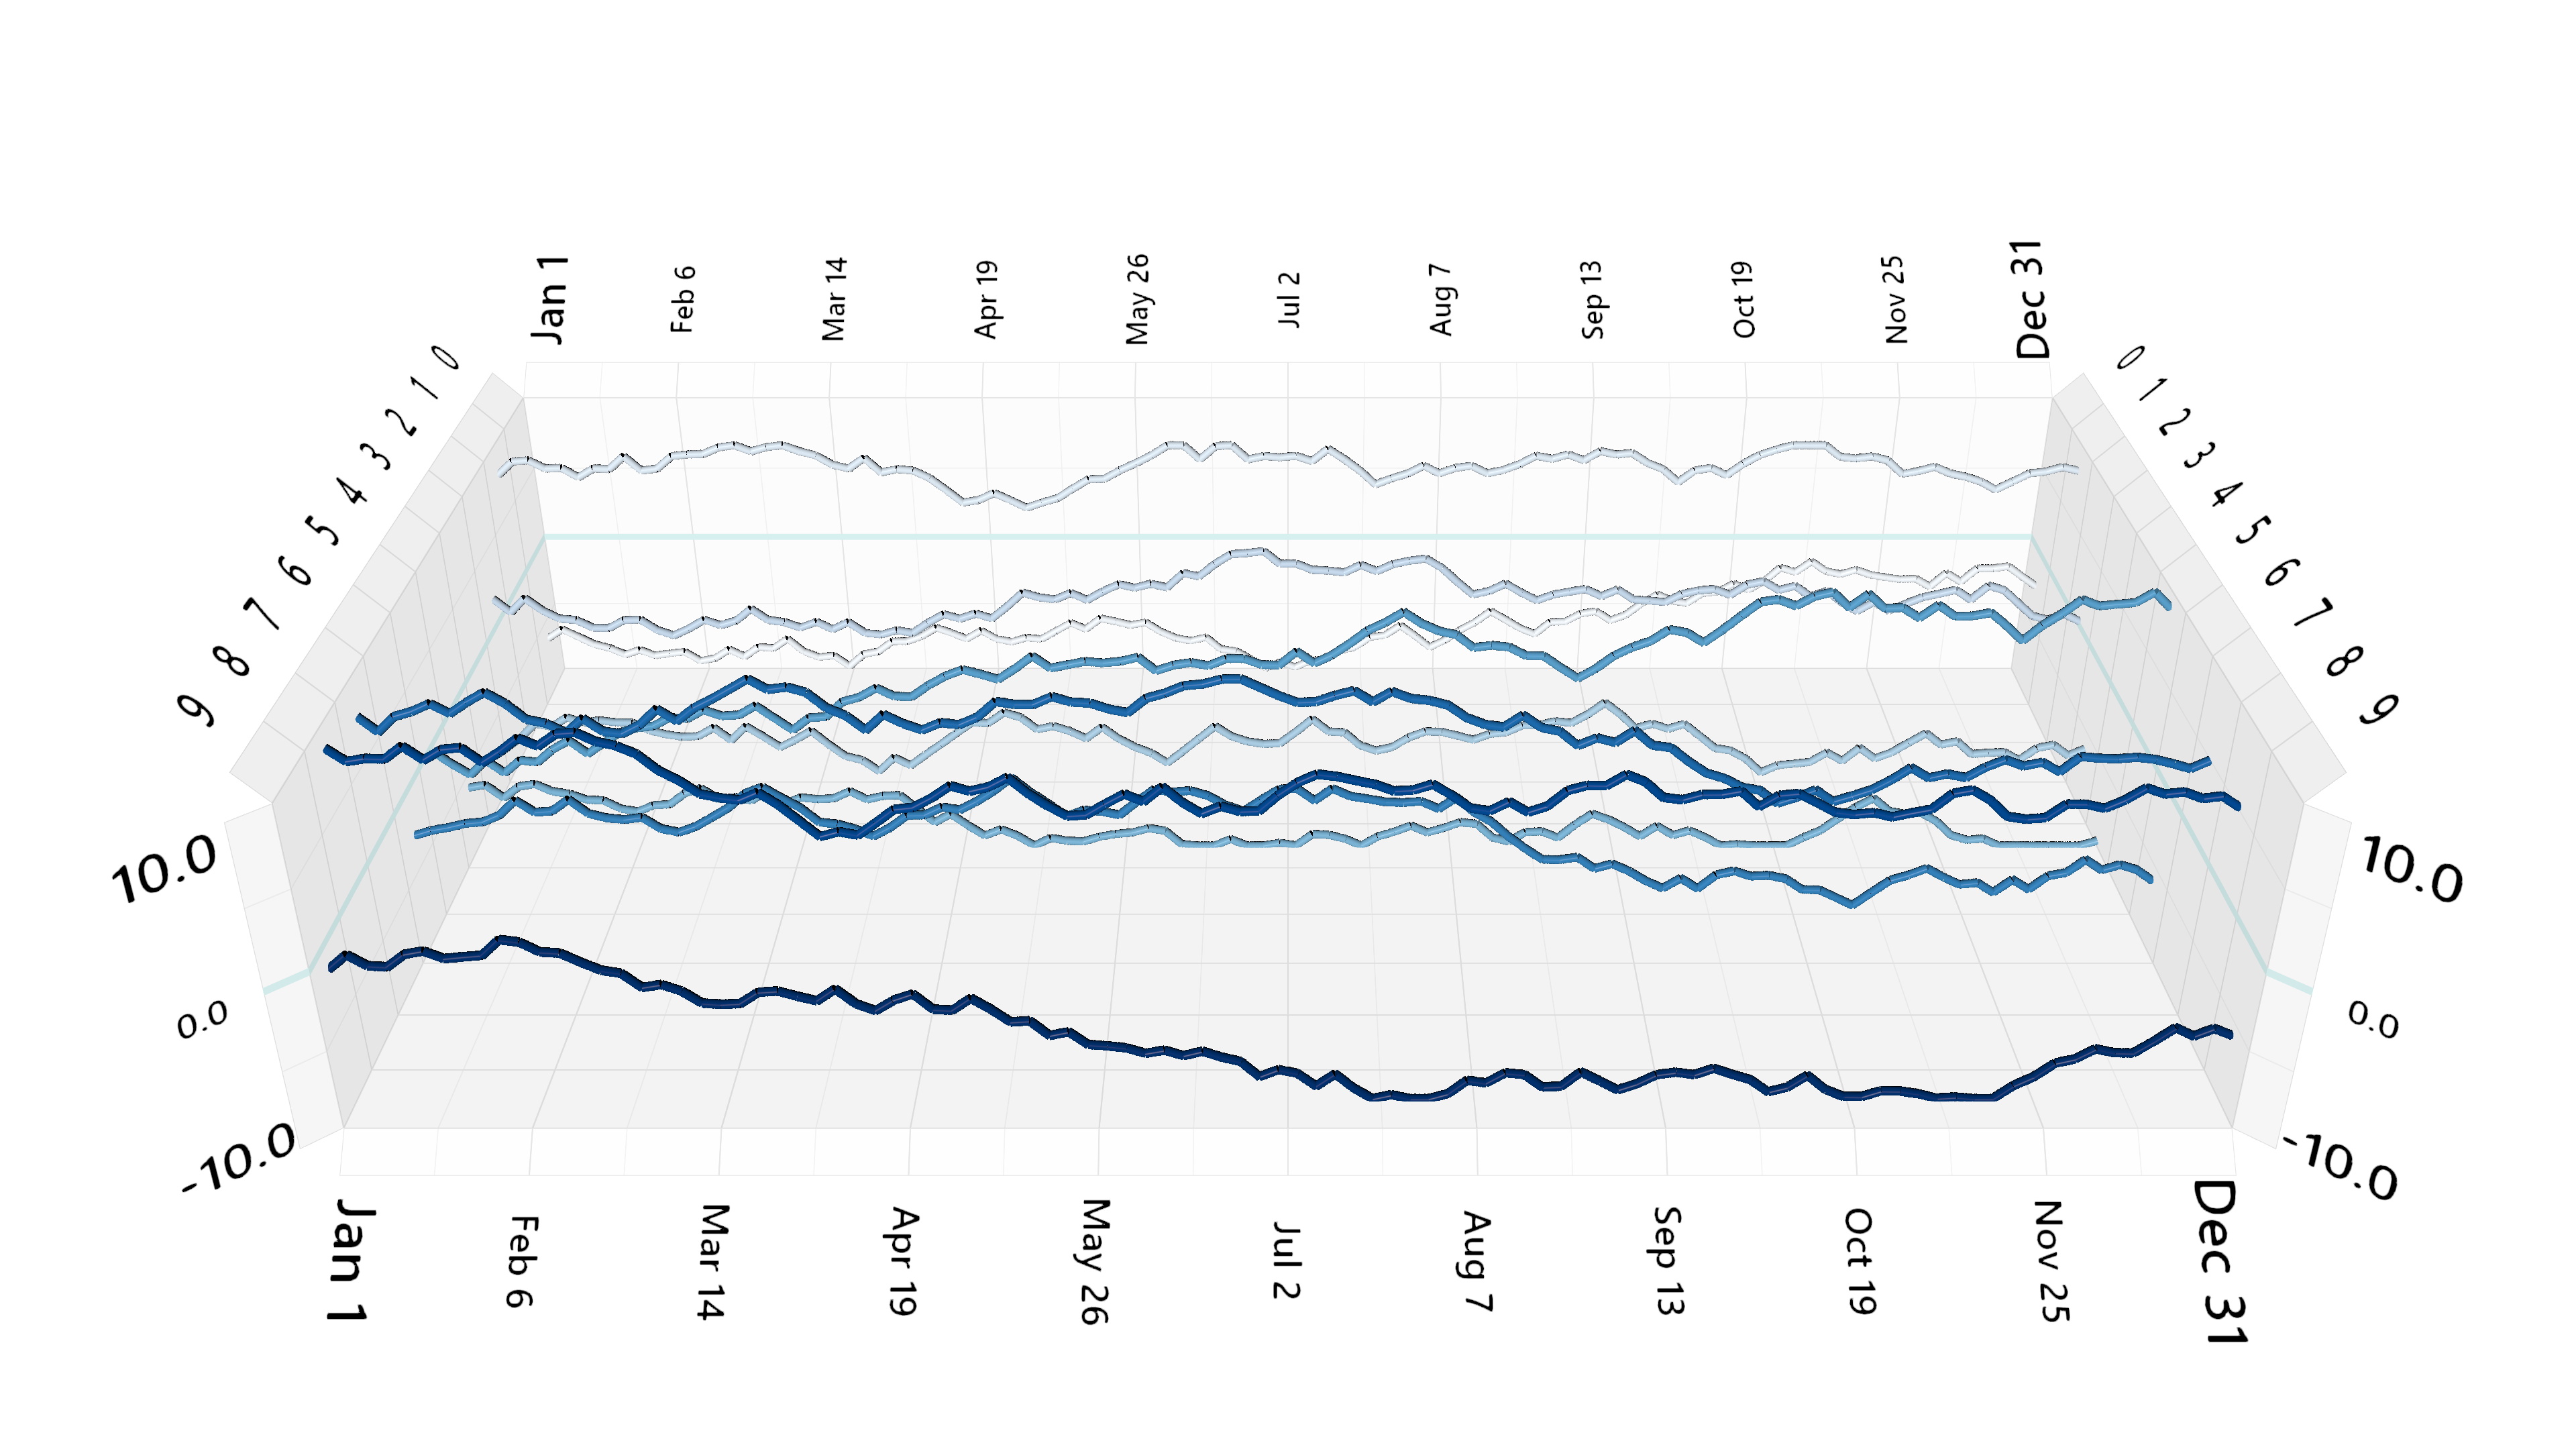
Line Chart
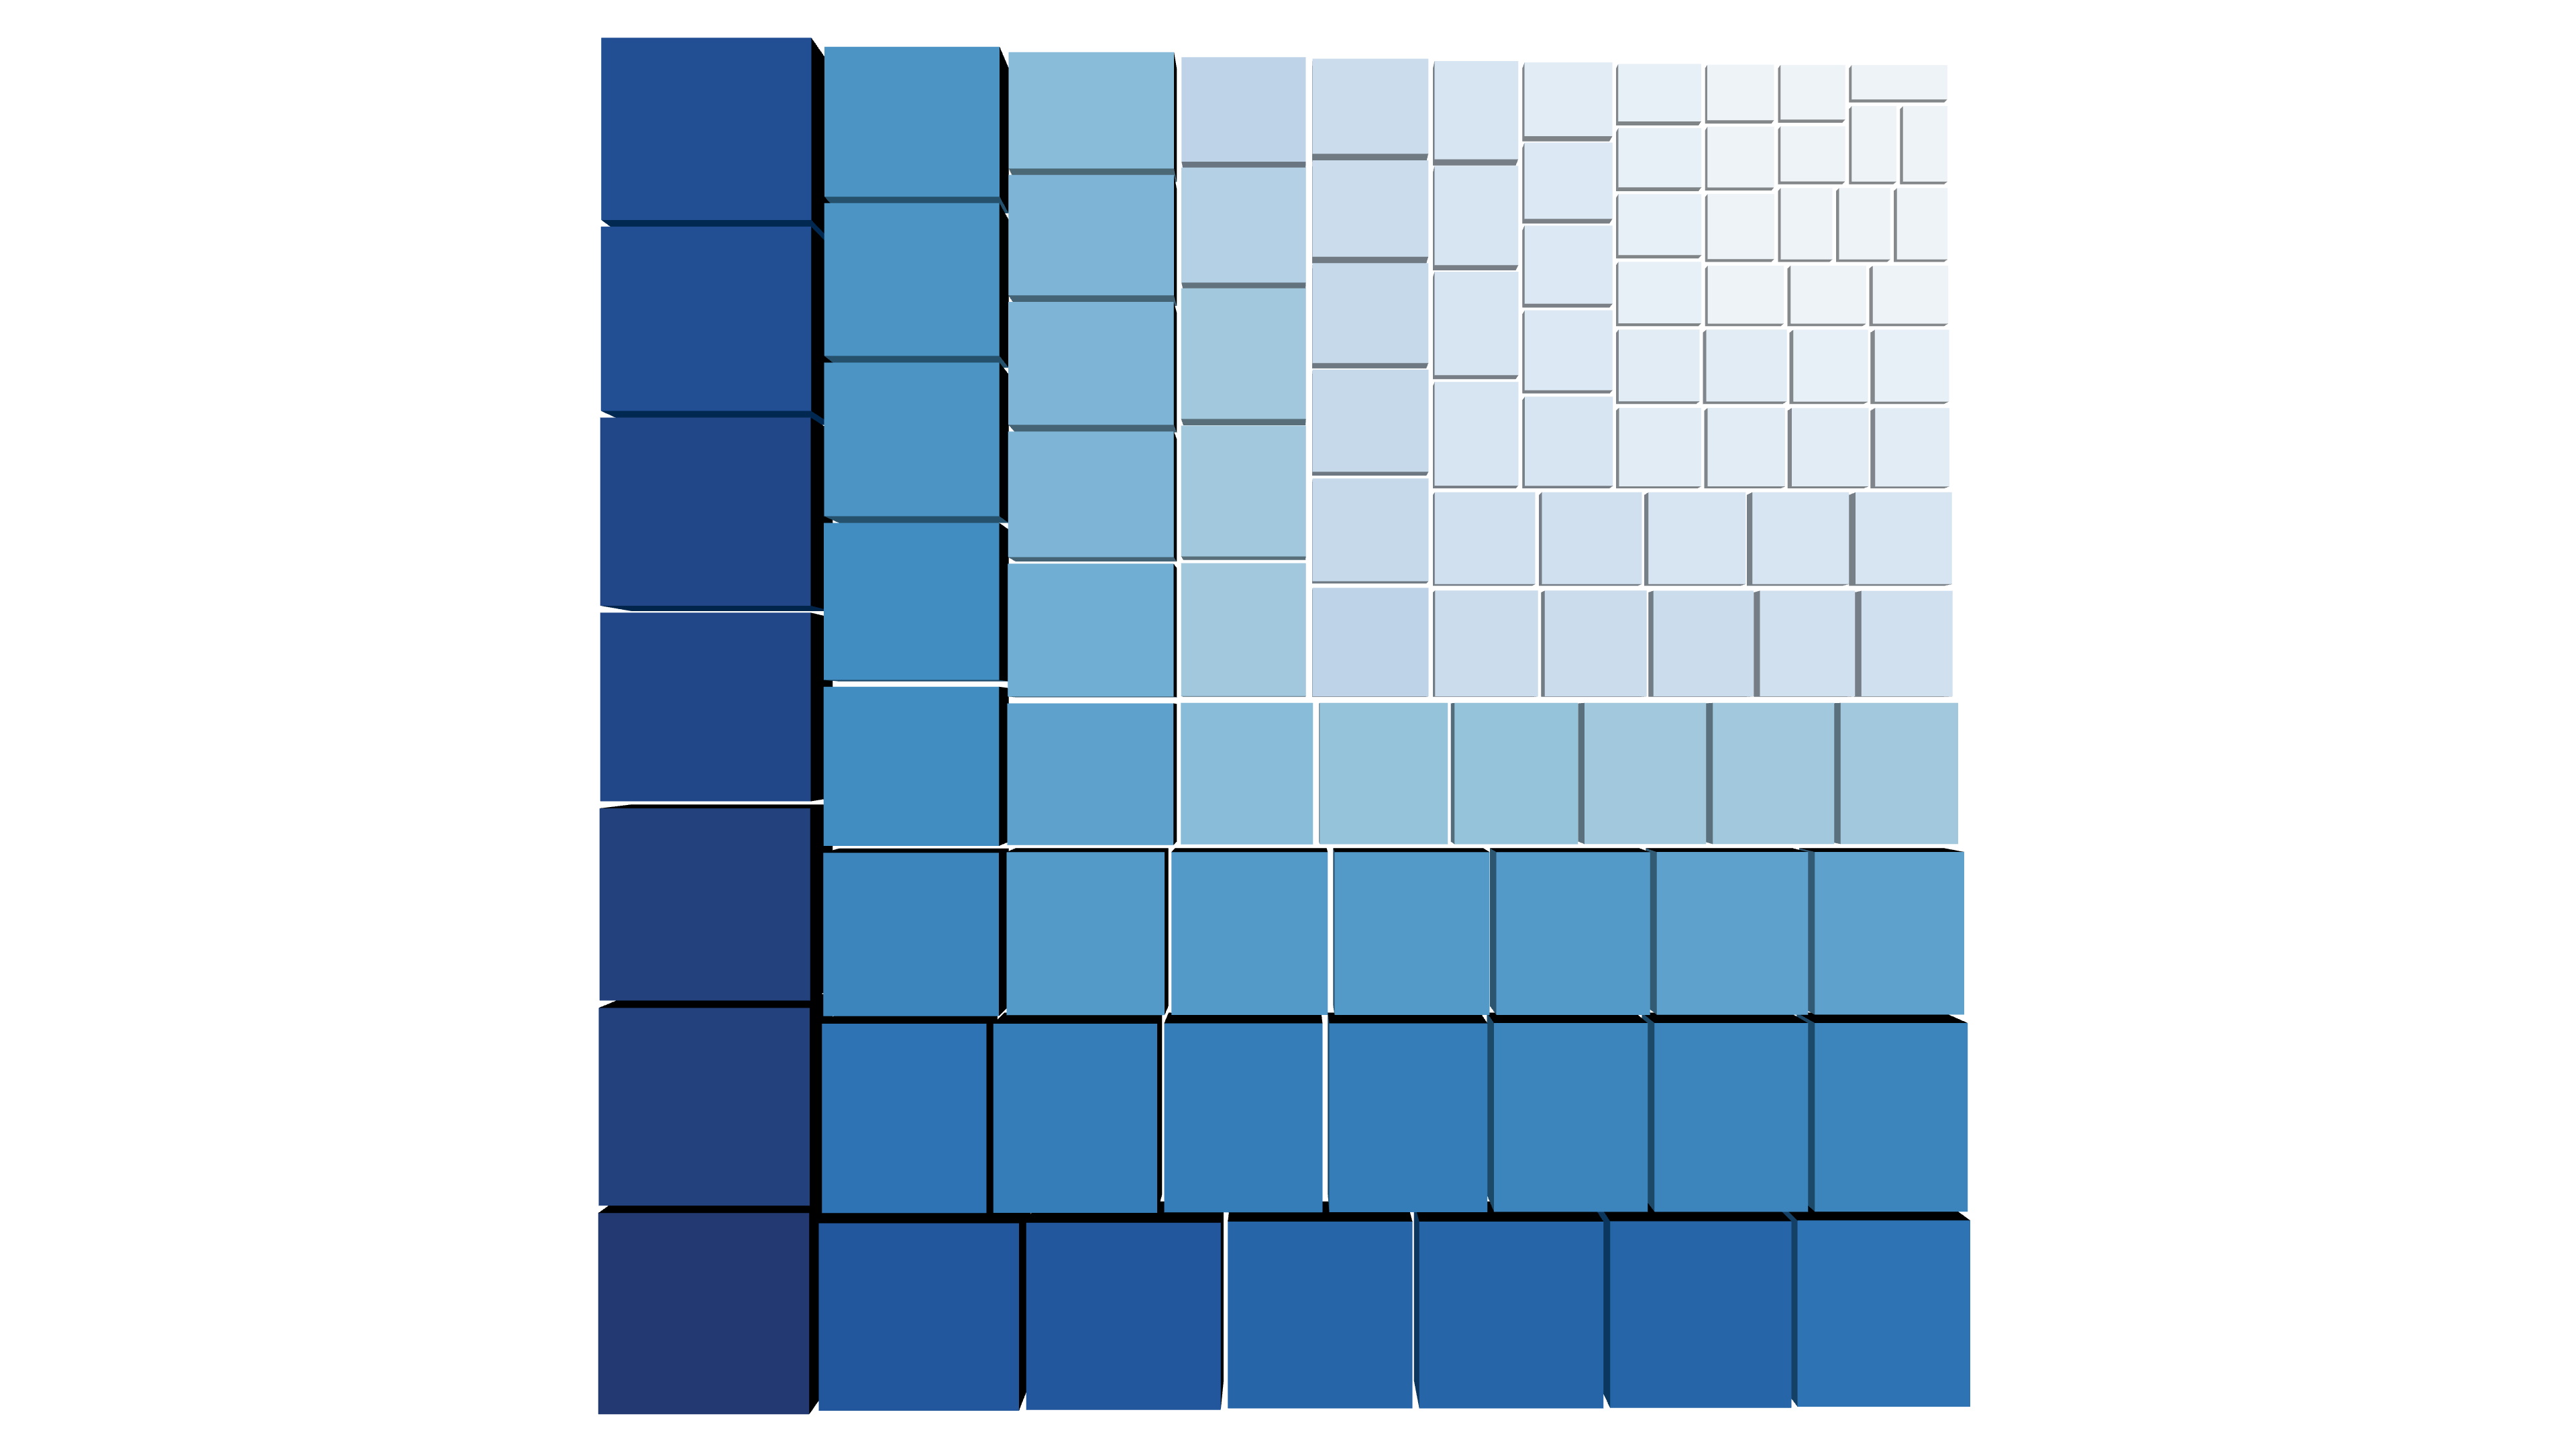
Squarified Treemap
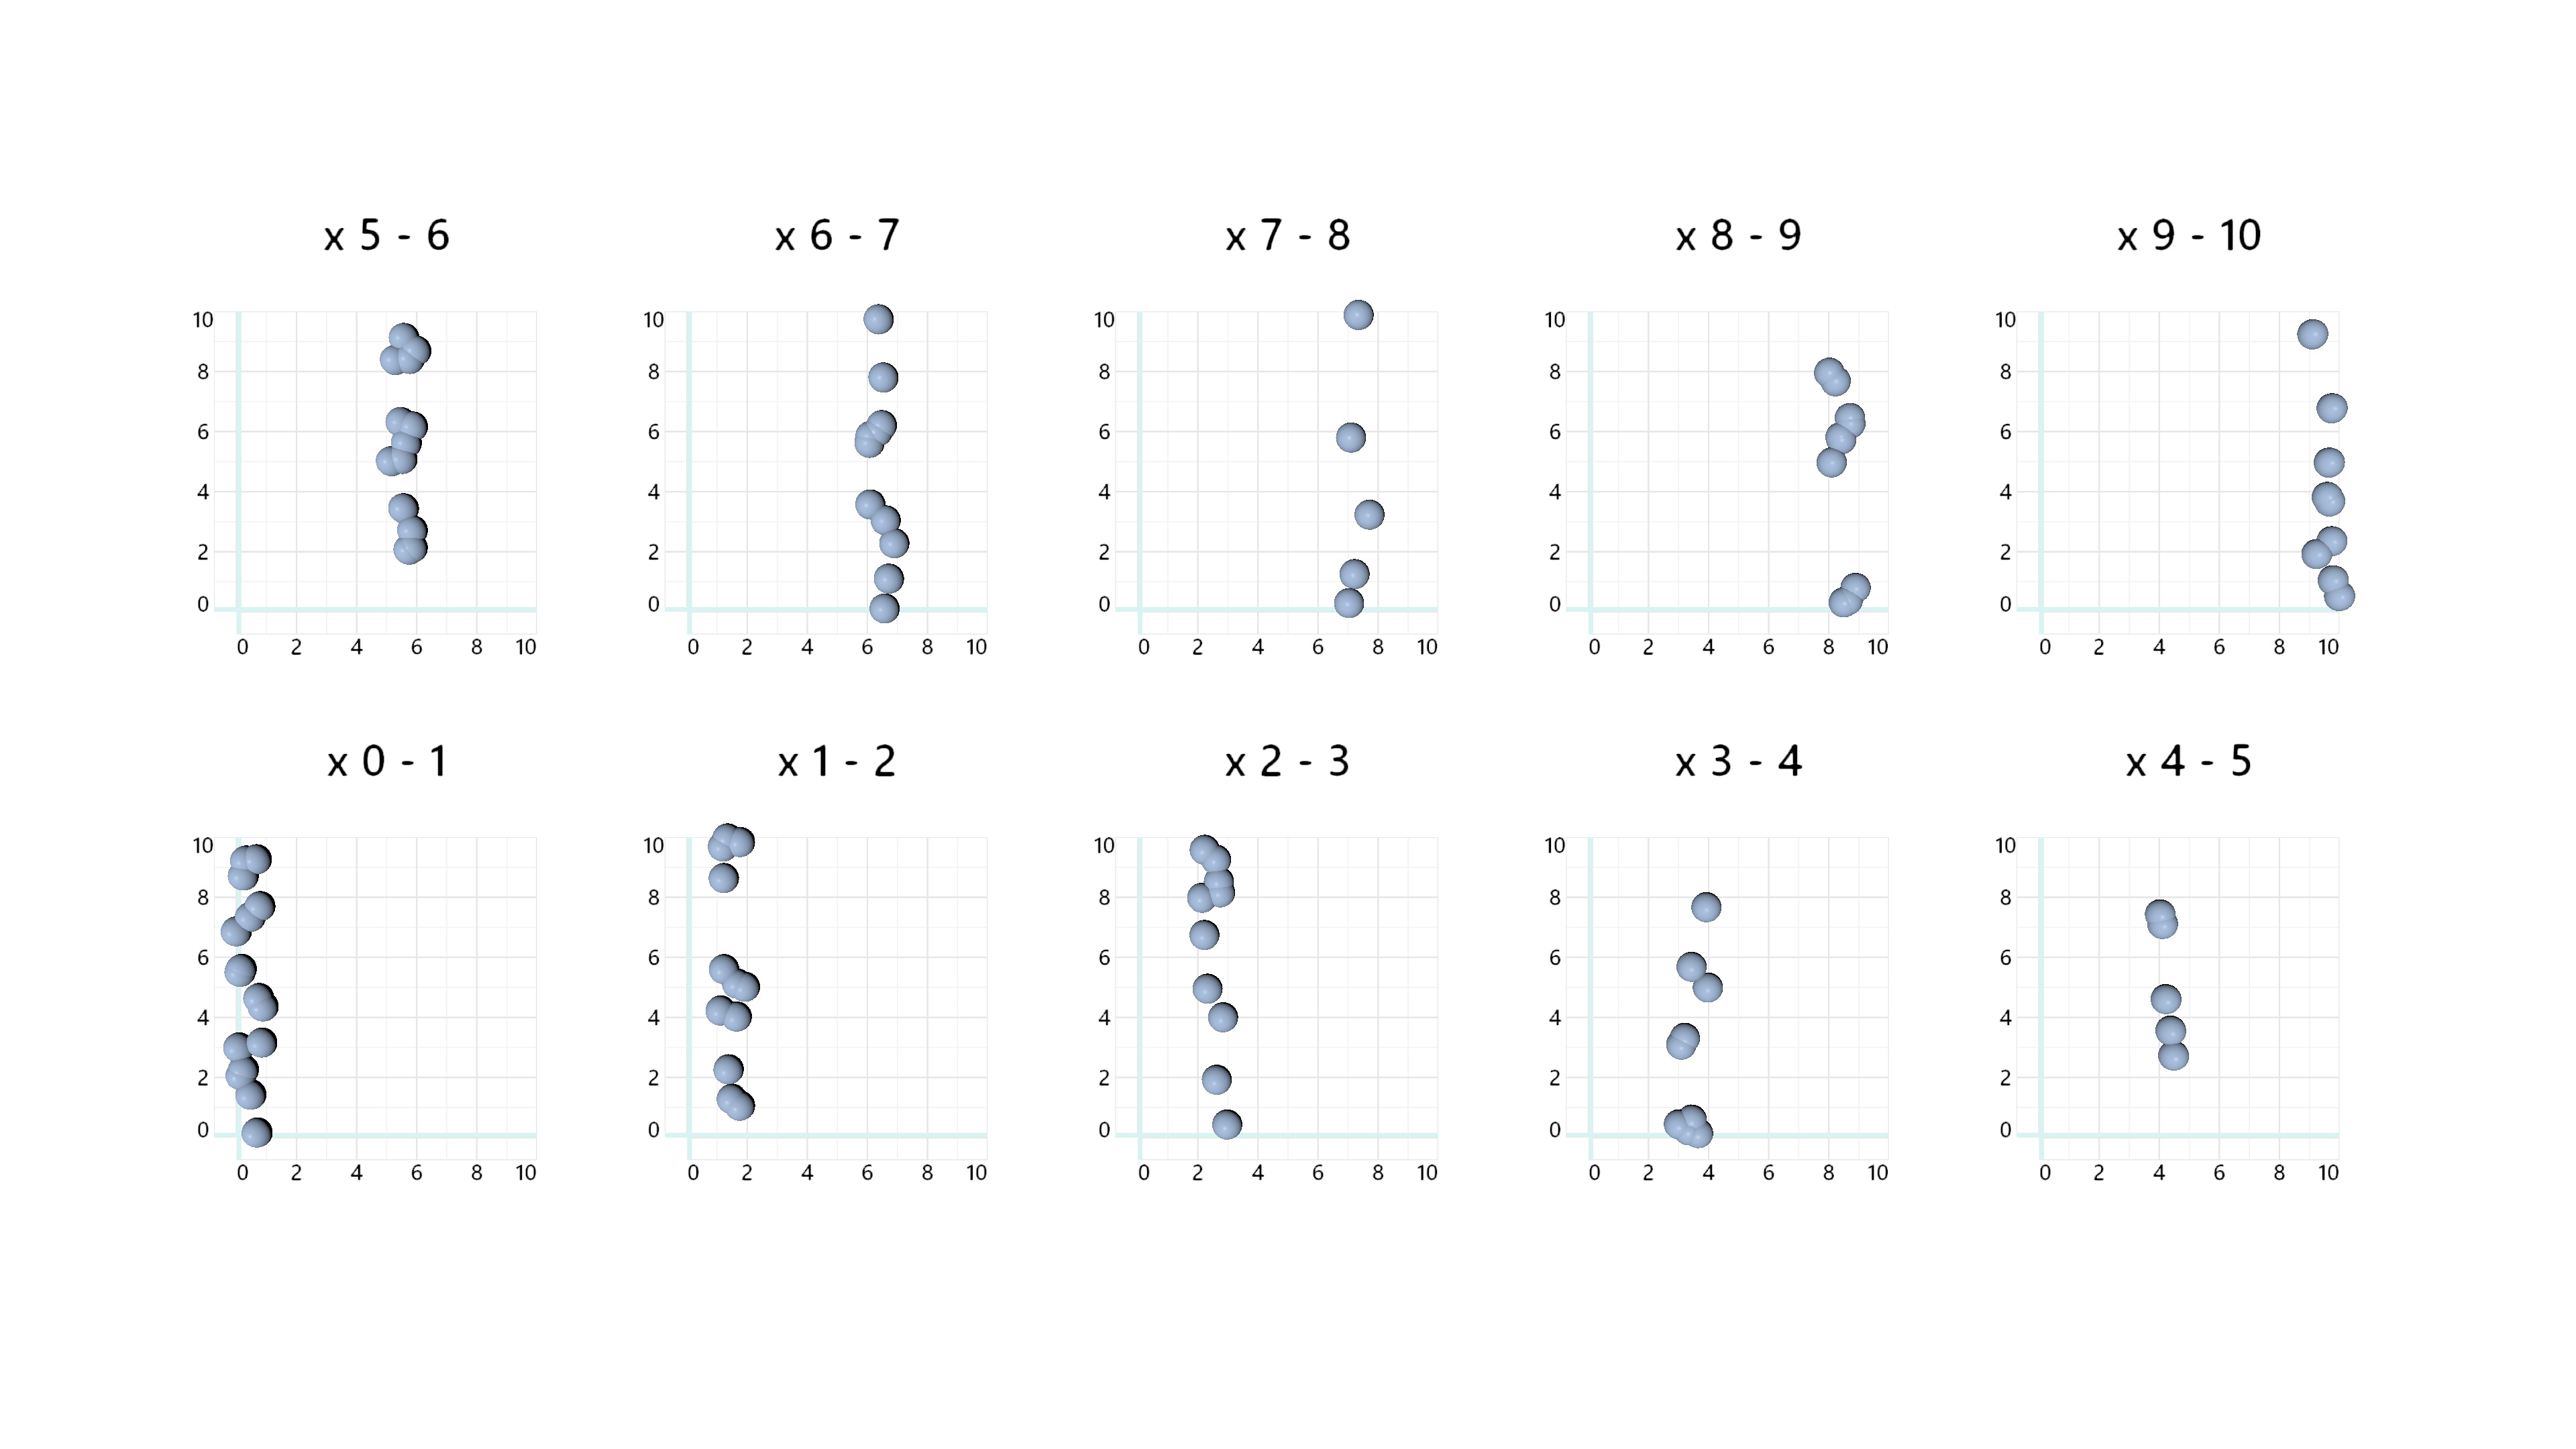
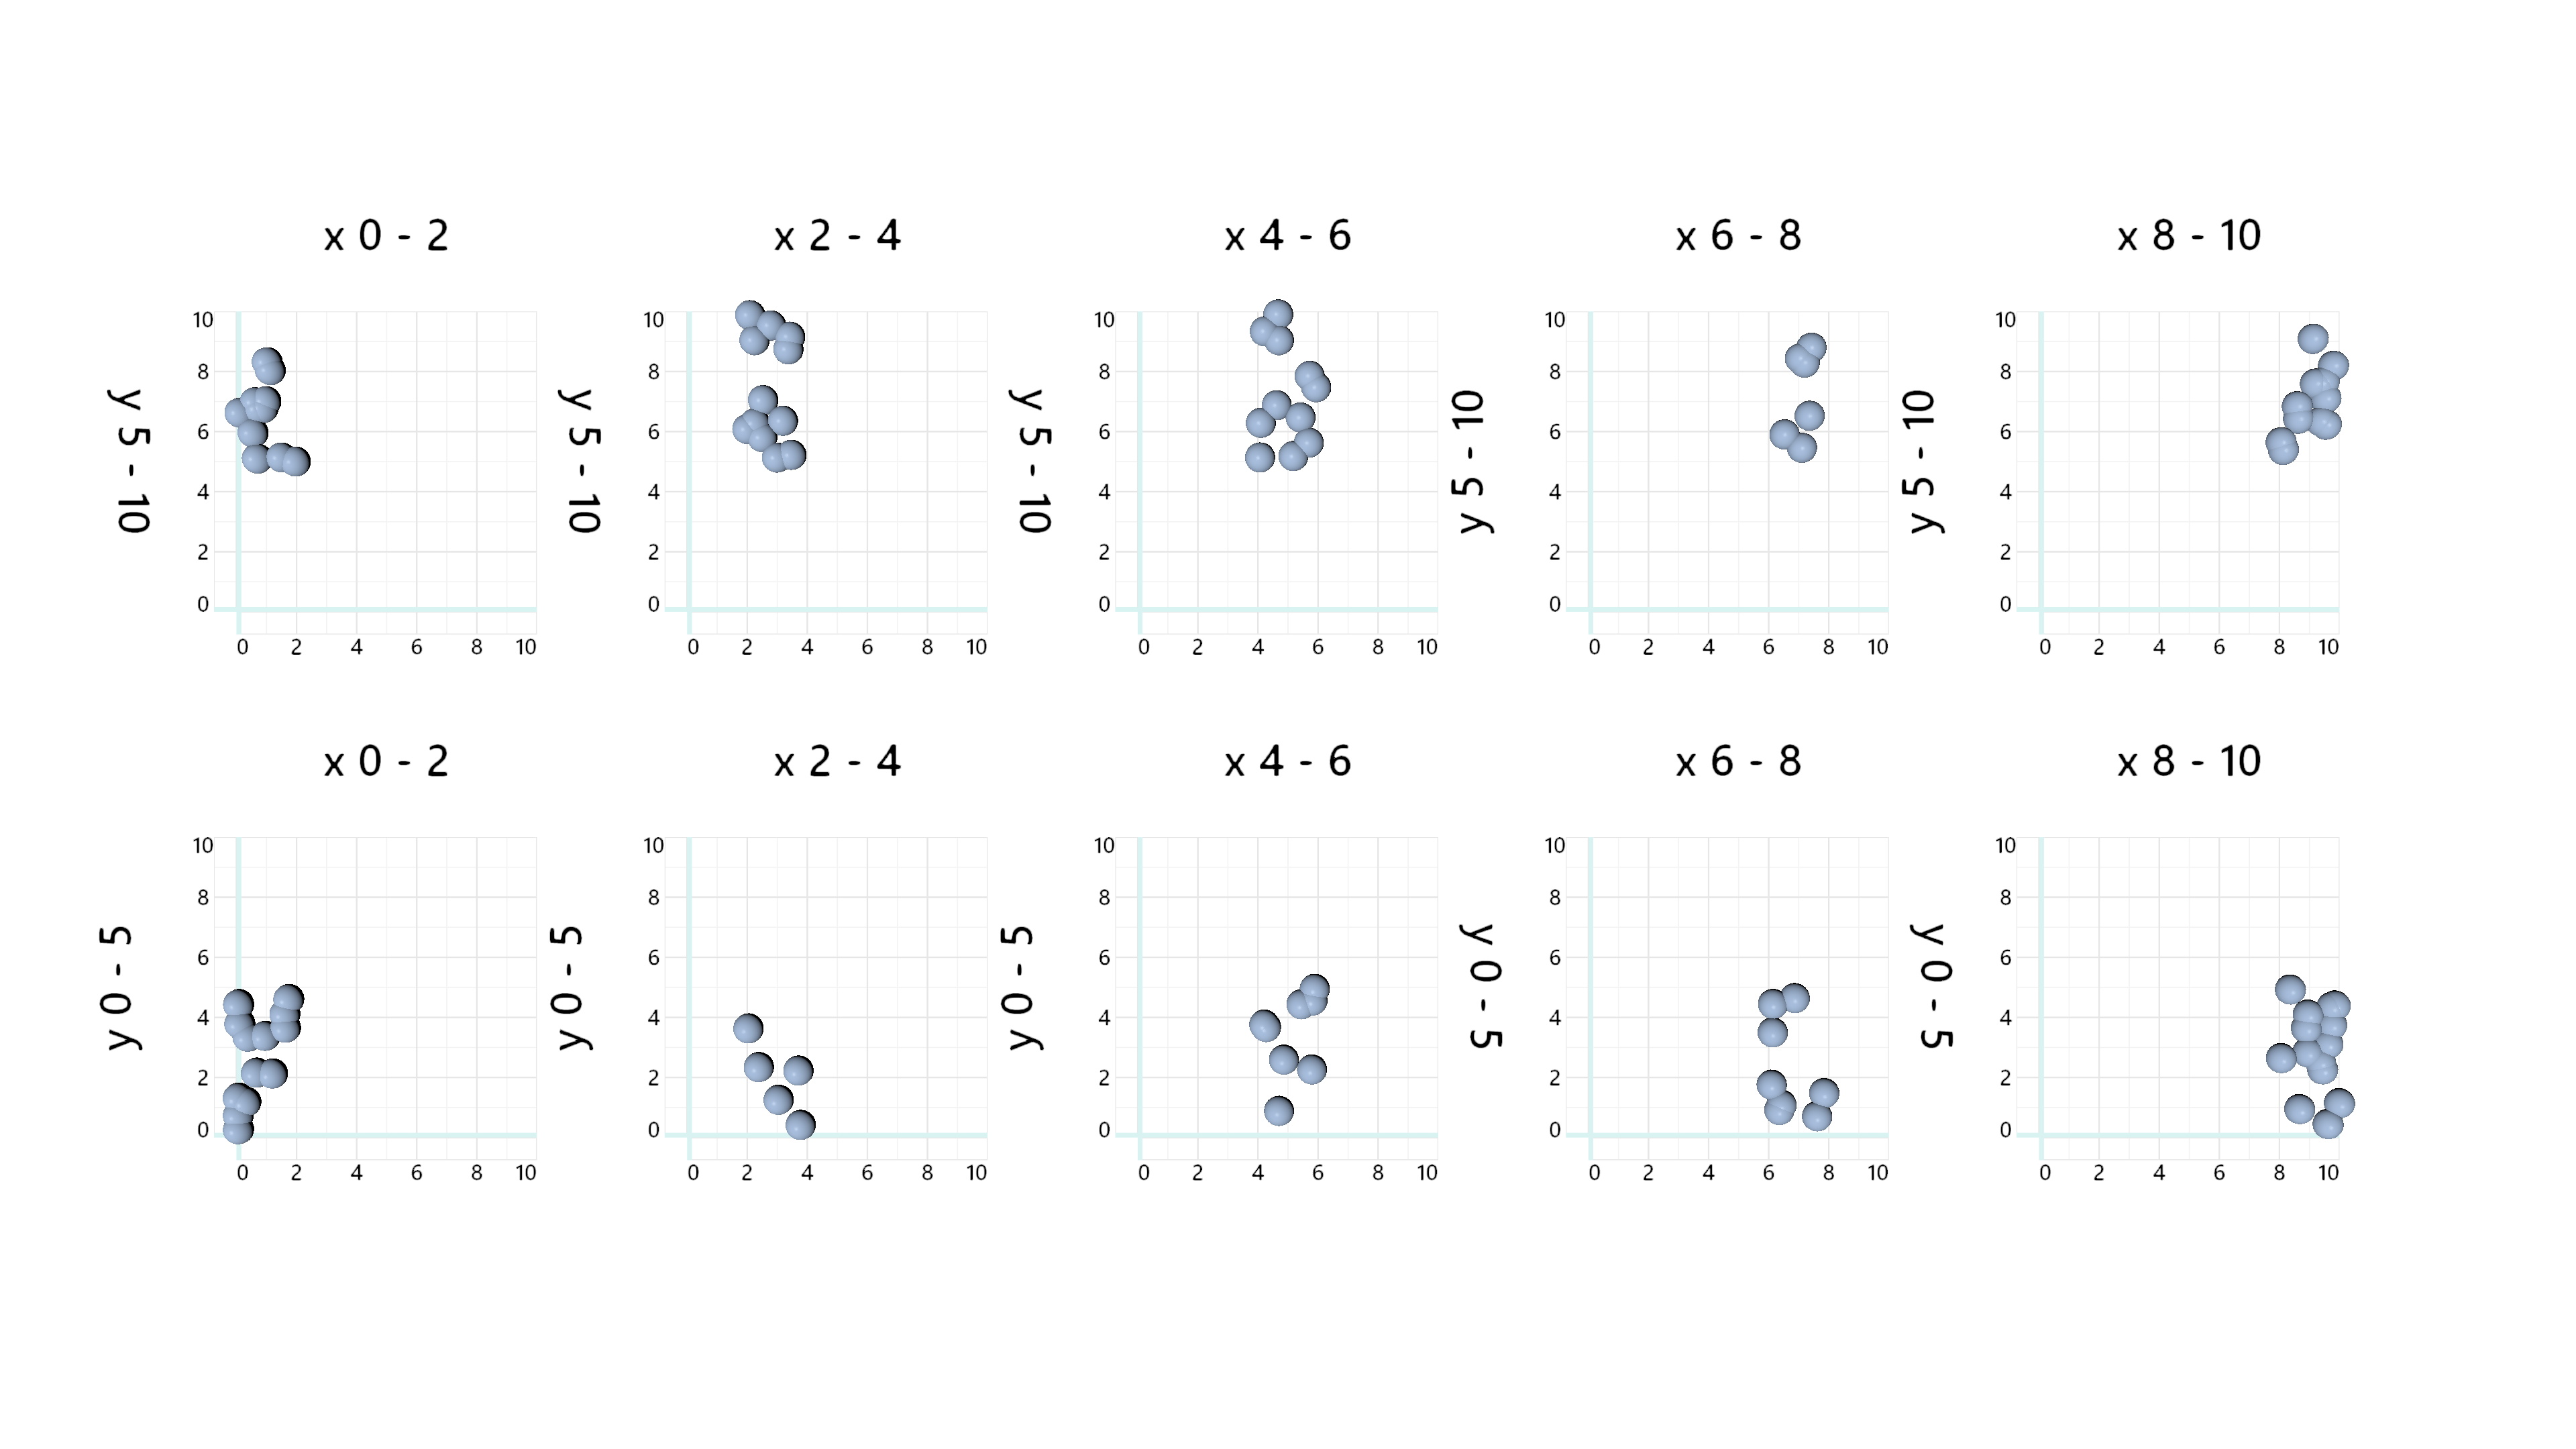
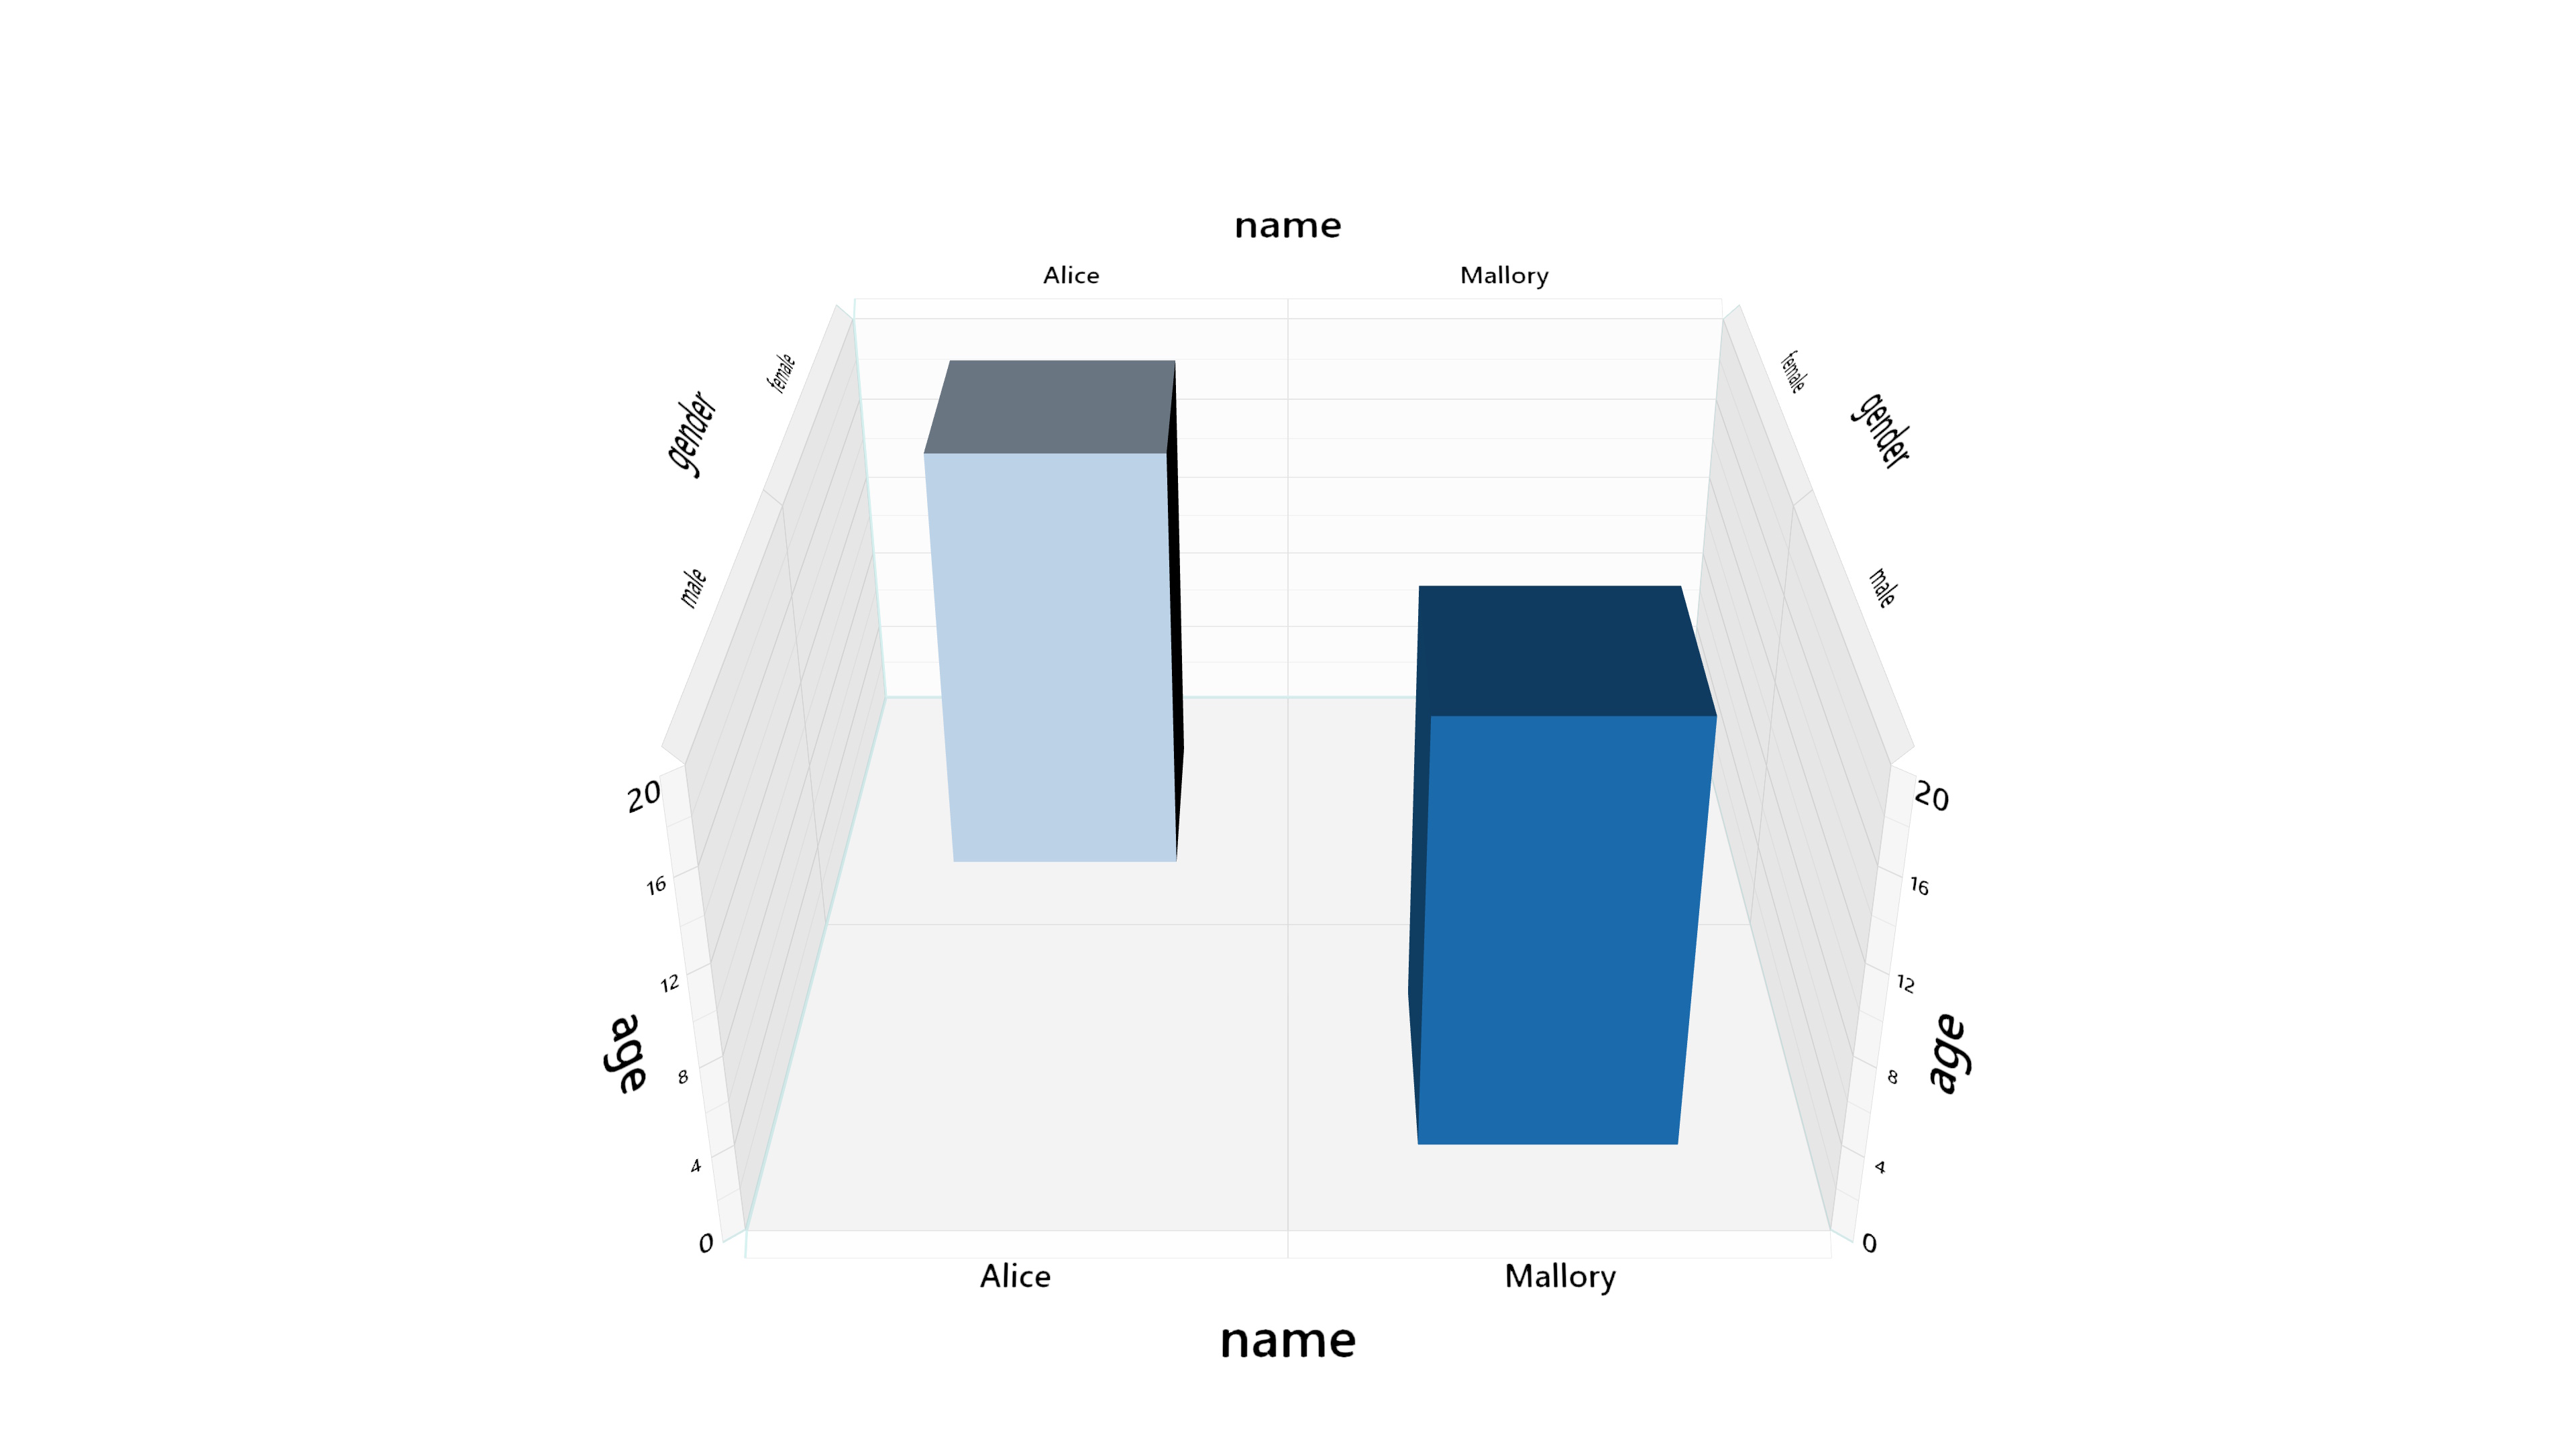
Facets
Wrap
Cross-Facet
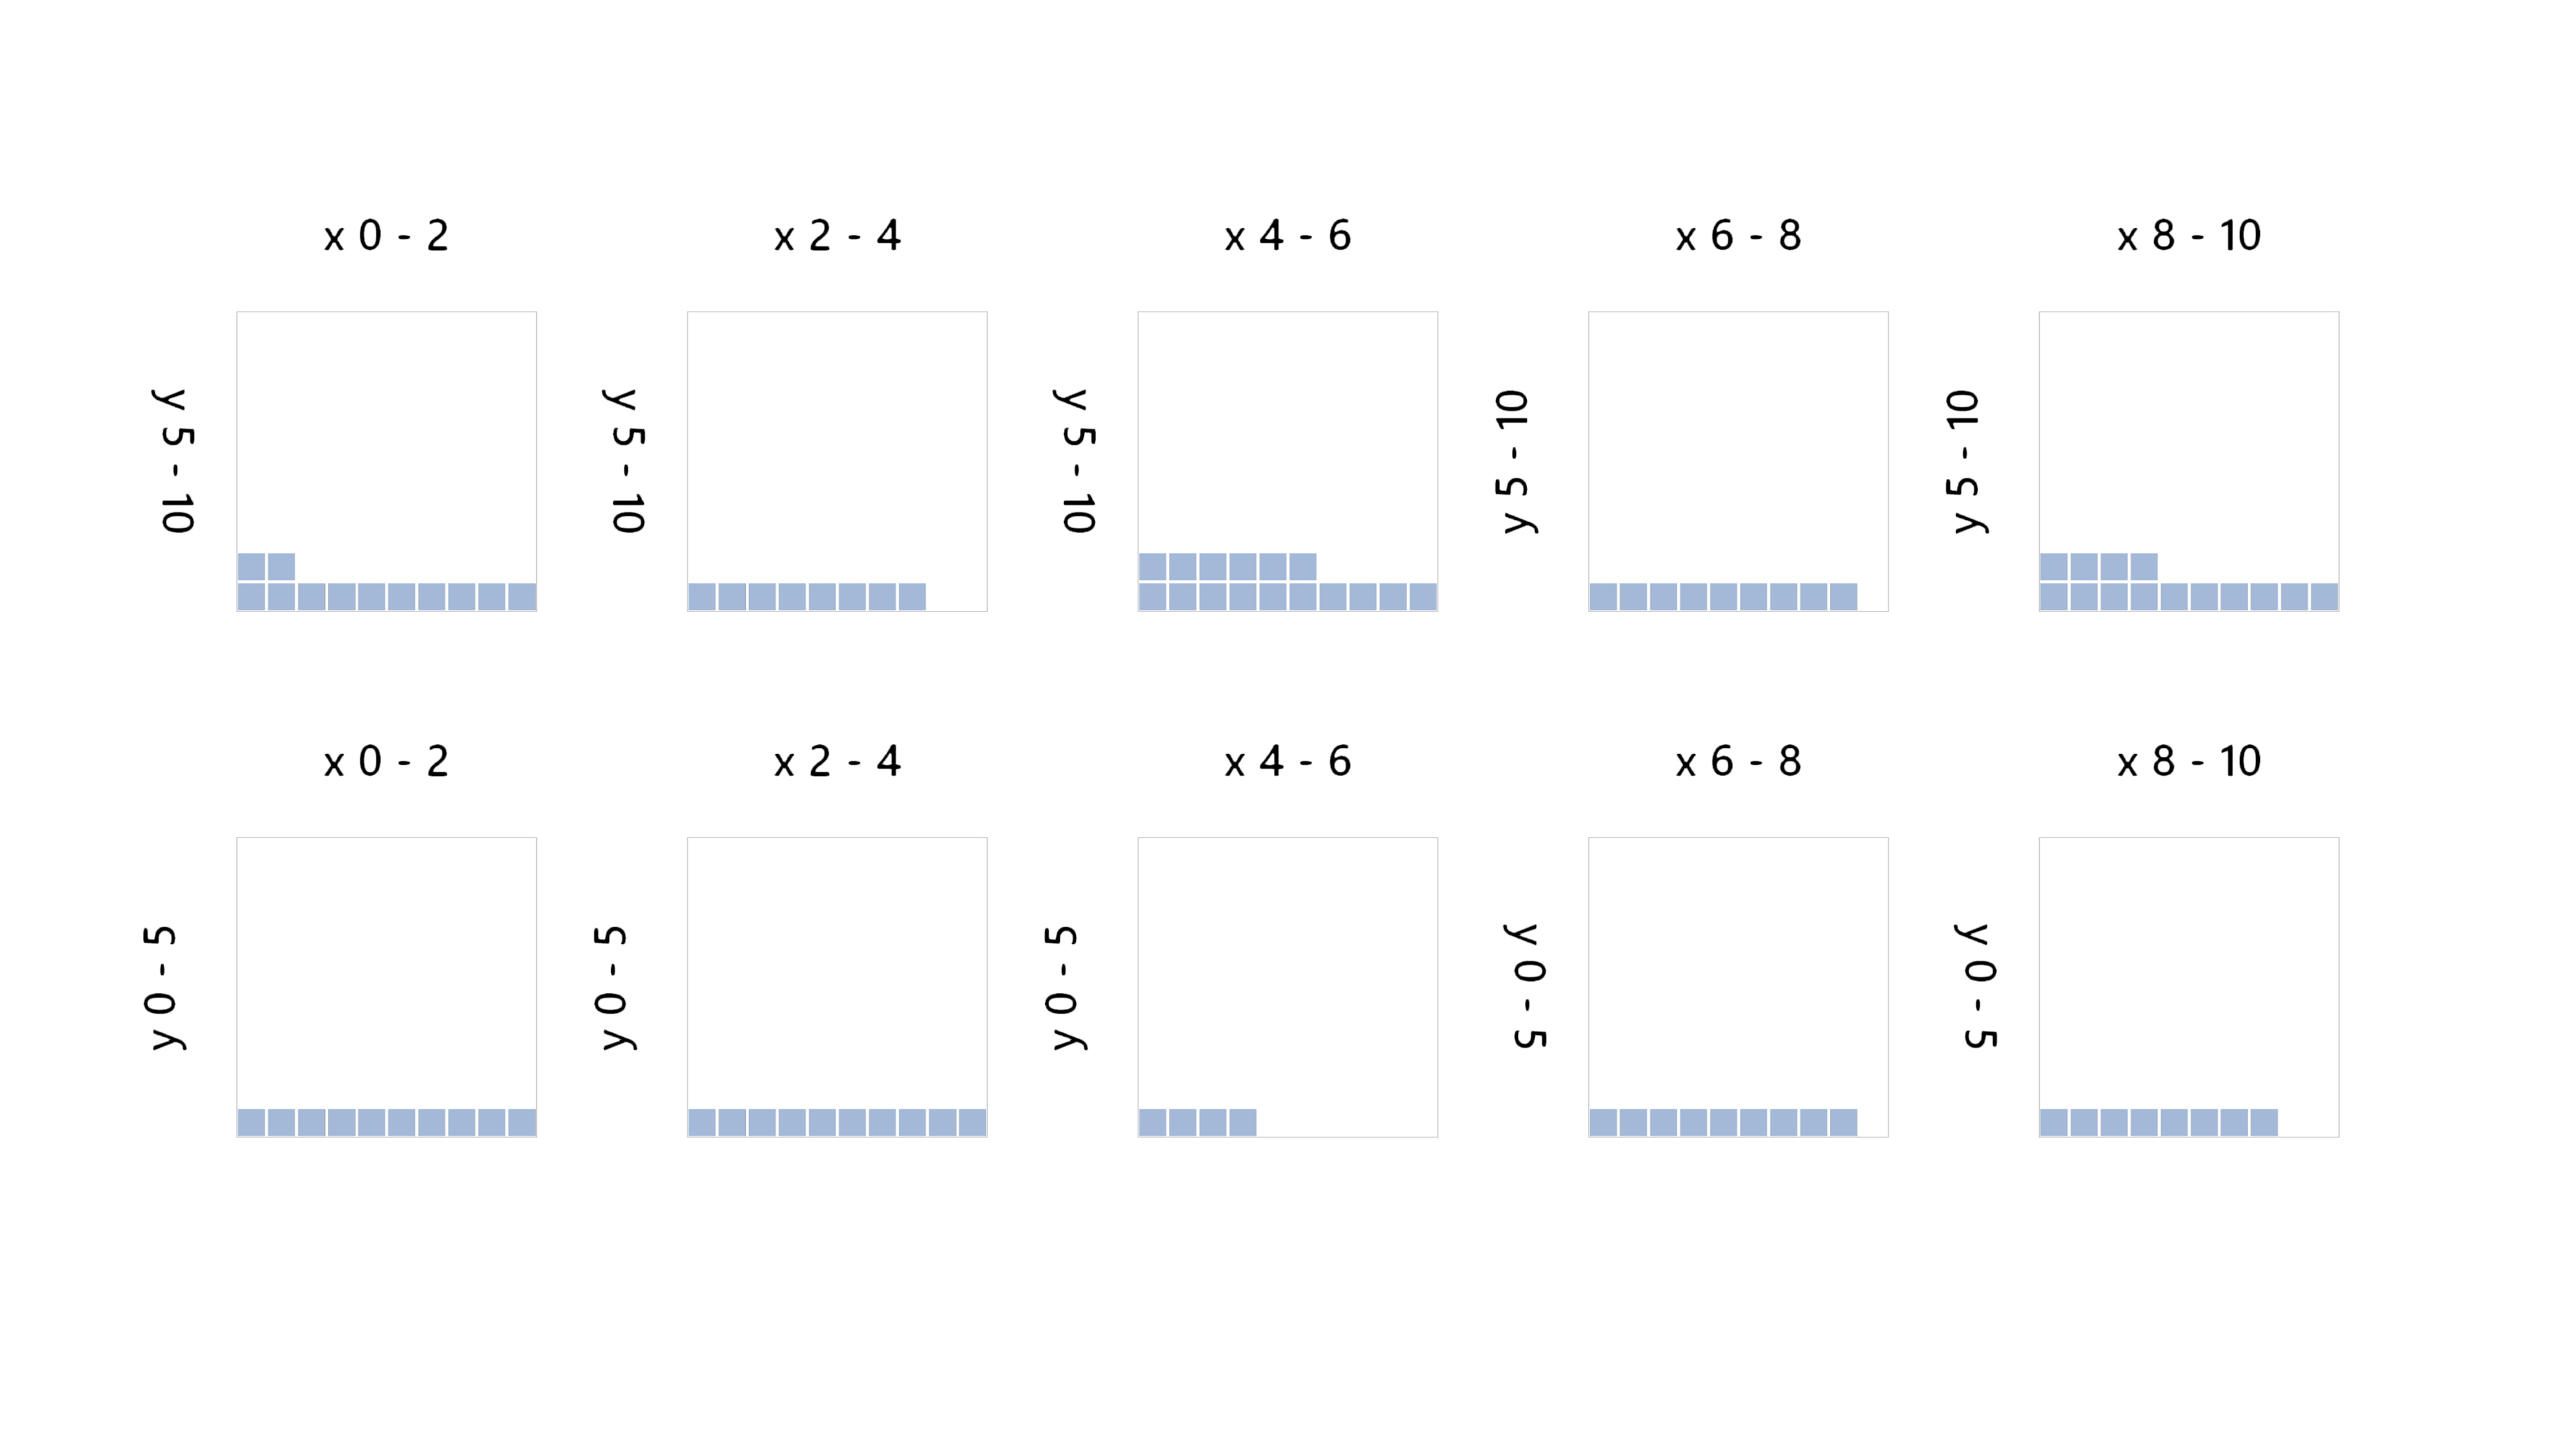
Layout Per Facet
layout() calls, after
calling resetCumulativeLayoutBounds(). The cumulative bounds are then available in
[min,max]CumulativeLayoutBounds[X,Y,Z]. Bounds can be specified manually, as in
this example.
Renderers
Cartesian2dAxes and Cartesian3dAxes are currently only supported in the
basic and advanced renderers, so axes must currently be drawn manually for the raytrace renderer.
Interaction
MorphCharts.Input.Manager processes input from touch, keyboard, mouse,
mousewheel, stylus, Surface Dial, and VR controllers.Selection
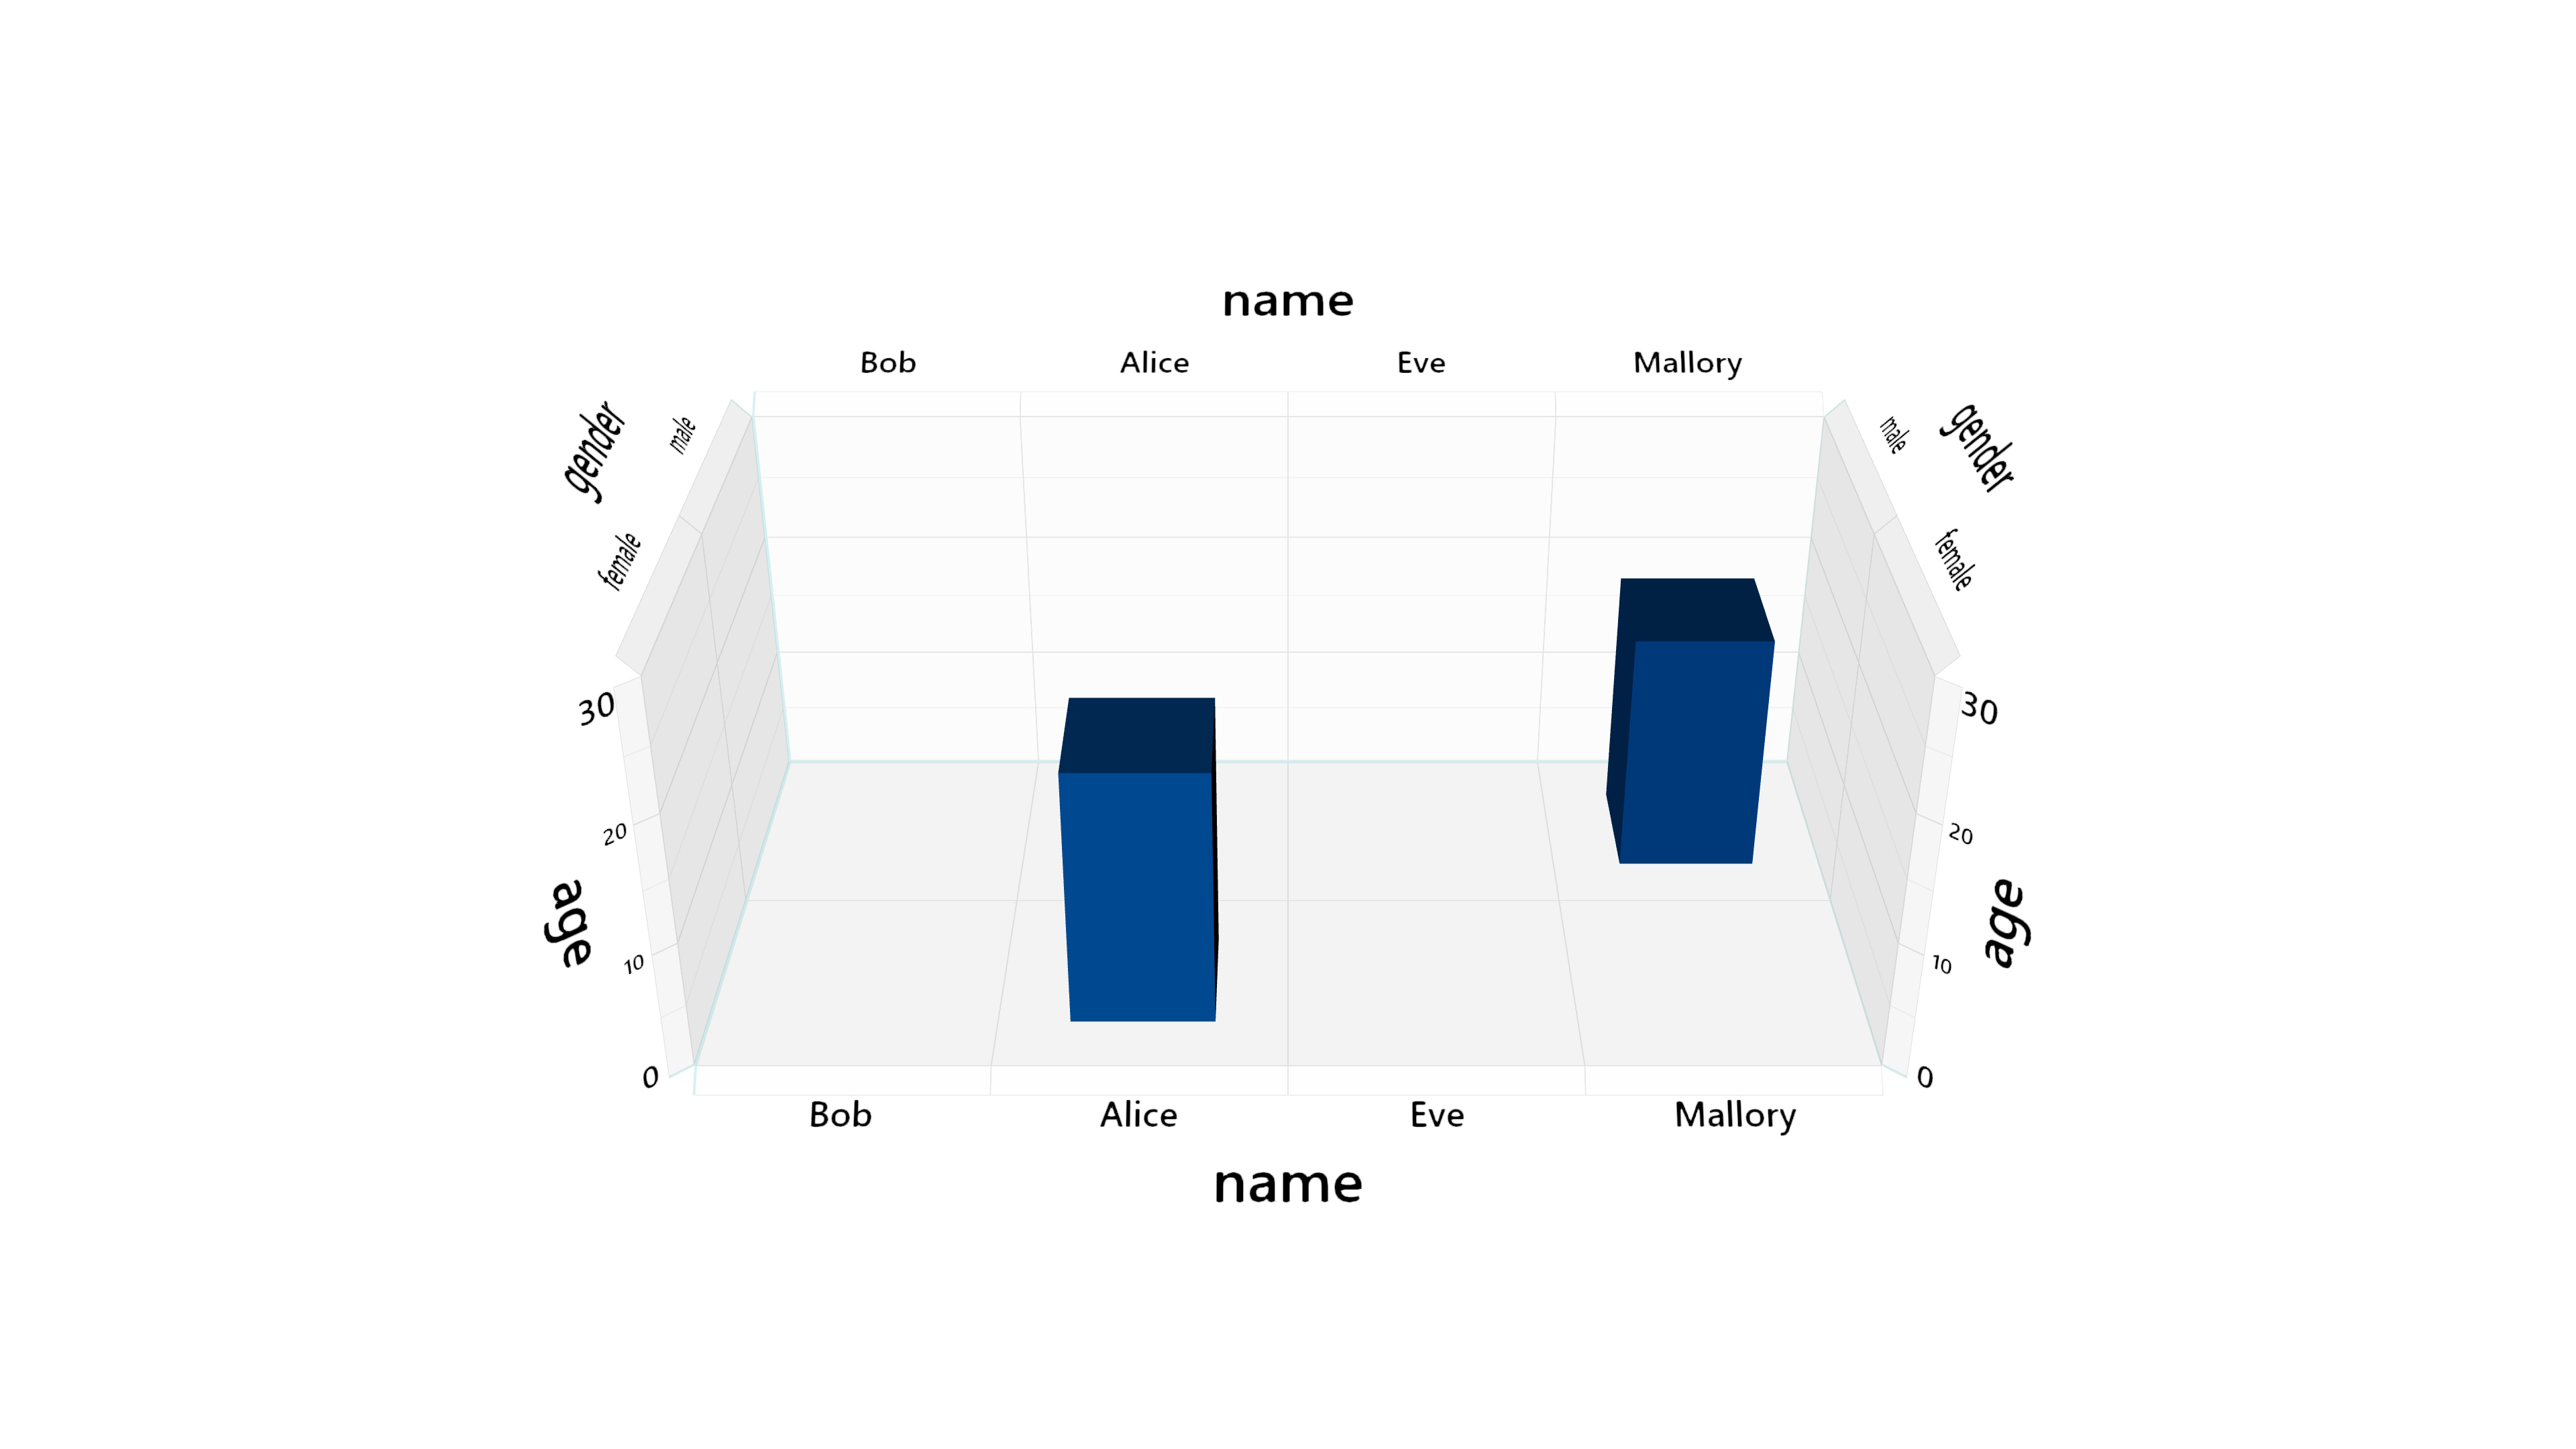
Filtering
Palettes
Axes
Cartesian2dAxes and Cartesian3dAxes are provided for 2D and 3D charts
respectively. The labels are not billboarded, but support arbitrary viewing directions by flipping
their orientation.
previousAxes and a set of currentAxes, such
that a different set of axes can be defined for the renderer's
TransitionBuffer.previousBuffer and TransitionBuffer.currentBuffer. The
relevant axes can then be shown by setting therenderer's axesVisibility to
AxesVisibility.previous,AxesVisibility.current, or
AxesVisibility.none. They can be flipped by calling
renderer.swapAxes().
Labels
Label or in groups using a LabelSet.
LabelSet can be aligned by specifying a set of
bounds in an arbitrary coordinate space. The allows, for example the same data values used for the
layouts to be used to position labels in a LabelSet.Transitions
TransitionBuffer supports animated transitions by providing a
currentBuffer and previousBuffer object. The renderer's
transitionTime property, a value in the range [0,1] interpolates between these two
buffers. The buffers can be flipped by calling the swap() method on the
TransitionBuffer.
IVertexOptions.staggerOrders, which accepts an array of values between [0,1]. If values
outside the range [0,1] are available in an existing array, the min and max can be passed using
minStaggerOrder and maxStaggerOrder respectively to allow the existing
array to be normalized. The order can also be reversed using the Boolean property
staggerOrderReverse. If no values are passed, the data order is used for the stagger
order. A single value can be used by setting IVertexOptions.staggerOrder to a number in
the range [0,1].
Transitions and Filtering
Fonts
Core. For
example, to increase the quality of the default font, use the following option:// High-quality SDF font
fontRasterizerOptions: {
fontAtlas: new MorphCharts.FontAtlas(2048, 2048),
fontSize: 192,
border: 24,
fontFamily: "\"segoe ui semibold\", sans-serif",
fontWeight: "normal",
fontStyle: "normal",
baseline: "alphabetic",
maxDistance: 64,
edgeValue: 0xc0,
},Data
TablesArraysTables
Table class provides a convenient way to work with tablular datasets. Data is
typically loaded from comma-delimited (.csv) files. Column datatypes can be inferred using a
helper class, or specified explicitly. The Table class will create a set of
JavaScript
Float64Arrays,
the values of which depend on each column's MorphCharts.ColumnType.
ColumnType.float (1) and ColumnType.integer (2) columns create an
array with the column values.ColumnType.string (4) columns create an array of indices into an array of
distinctStrings for each column.
ColumnType.date (4) columns create an array of JavaScript Date
timestamps, defined as time in elapsed milliseconds from midnight at the beginning of
January 1, 1970.Layout classes, and properties such as
minValue and maxValue used for axes.
Table, create a Filter. When a
Table is initially created, a defailt Filter called
"all" is created for the entire table.
Table for
the Layout class Layout and the Filter for the
Layout class
Update.
Arrays
Tables, but require additional code. When
creating a TransitionBuffer from an array, the ids should be a contiguous list of
integers starting at 0 (the Table class creates these automatically). This allows a
filtered subset of ids to be used with Layout classes, along with additional,
unfiltered data arrays.Ray Tracing
Materials
LambertianMaterial,
GlossyMaterial, MetalMaterial (fuzz: 0),
MetalMaterial (fuzz: 0.5) and DielectricMaterial
materials respectively.
Unit Types
Motion Blur
Debugging
core.config.logLevel = MorphCharts.LogLevel.debug;
core.config.isDebugVisible = true;
const debug = document.getElementById("debug");
core.updateCallback = () => {
    debug.innerText = core.debugText.text;
};
The following apps use the MorphCharts library.
MorphCharts is a project from Microsoft Research. For questions and issues please contact morphcharts@microsoft.com.